29
/
en
AIzaSyAYiBZKx7MnpbEhh9jyipgxe19OcubqV5w
April 1, 2024
146905
Guinea-Bissau
GNB
true
2
1
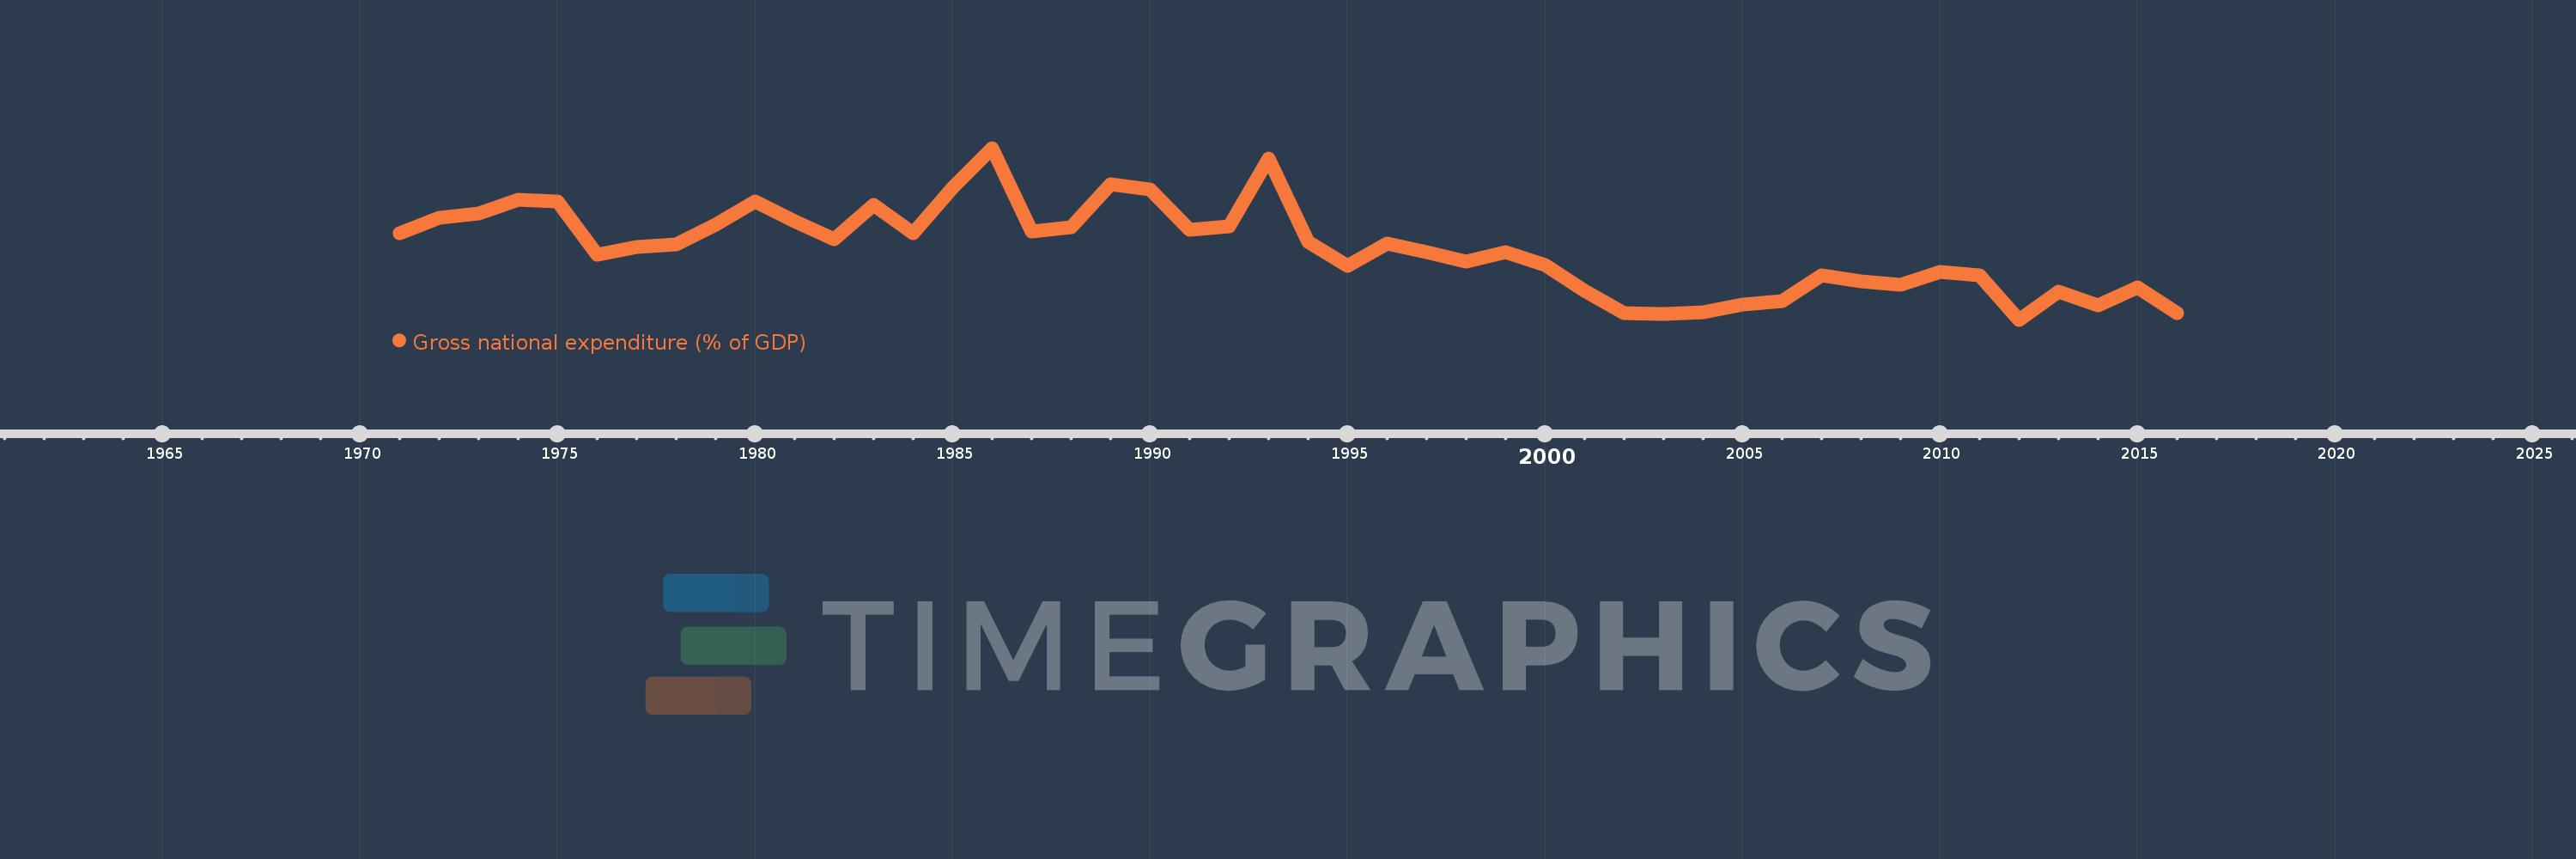
Gross national expenditure (% of GDP)
2016,2015,2014,2013,2012,2011,2010,2009,2008,2007,2006,2005,2004,2003,2002,2001,2000,1999,1998,1997,1996,1995,1994,1993,1992,1991,1990,1989,1988,1987,1986,1985,1984,1983,1982,1981,1980,1979,1978,1977,1976,1975,1974,1973,1972,1971
This statistics in other country:
AfghanistanAlbaniaAlgeriaAngolaAntigua and BarbudaArgentinaArmeniaArubaAustraliaAustriaAzerbaijanBahamas, TheBahrainBangladeshBarbadosBelarusBelgiumBelizeBeninBermudaBhutanBoliviaBosnia and HerzegovinaBotswanaBrazilBrunei DarussalamBulgariaBurkina FasoBurundiCabo VerdeCambodiaCameroonCanadaCentral African RepublicChadChileChinaColombiaComorosCongo, Dem. Rep.Congo, Rep.Costa RicaCote d'IvoireCroatiaCubaCyprusCzech RepublicDenmarkDjiboutiDominicaDominican RepublicEcuadorEgypt, Arab Rep.El SalvadorEquatorial GuineaEritreaEstoniaEthiopiaFaroe IslandsFijiFinlandFranceGabonGambia, TheGeorgiaGermanyGhanaGreeceGrenadaGuatemalaGuineaGuinea-BissauGuyanaHaitiHondurasHong Kong SAR, ChinaHungaryIcelandIndiaIndonesiaIran, Islamic Rep.IraqIrelandIsraelItalyJamaicaJapanJordanKazakhstanKenyaKiribatiKorea, Rep.KosovoKuwaitKyrgyz RepublicLao PDRLatviaLebanonLesothoLiberiaLibyaLithuaniaLuxembourgMacao SAR, ChinaMacedonia, FYRMadagascarMalawiMalaysiaMaldivesMaliMaltaMauritaniaMauritiusMexicoMicronesia, Fed. Sts.MoldovaMongoliaMontenegroMoroccoMozambiqueNamibiaNepalNetherlandsNew CaledoniaNew ZealandNicaraguaNigerNigeriaNorwayOmanPakistanPanamaPapua New GuineaParaguayPeruPhilippinesPolandPortugalPuerto RicoQatarRomaniaRussian FederationRwandaSaudi ArabiaSenegalSerbiaSeychellesSierra LeoneSingaporeSlovak RepublicSloveniaSolomon IslandsSomaliaSouth AfricaSouth SudanSpainSri LankaSt. Kitts and NevisSt. LuciaSt. Vincent and the GrenadinesSudanSurinameSwazilandSwedenSwitzerlandSyrian Arab RepublicTajikistanTanzaniaThailandTimor-LesteTogoTongaTrinidad and TobagoTunisiaTurkeyTurkmenistanUgandaUkraineUnited Arab EmiratesUnited KingdomUnited StatesUruguayUzbekistanVanuatuVenezuela, RBVietnamWest Bank and GazaYemen, Rep.ZambiaZimbabwe Timeline:
This timeline shows a graph from 1971 to 2016 of Guinea-Bissau. No data until 1970. Number of actual observations by date: 46.
Source name:
World Development Indicators
Source organization:
World Bank national accounts data, and OECD National Accounts data files.
Categories, topics:
Economy & Growth
Last updated:
apr 23, 2017
Indicators value changes by year
Minimum:
104.029
jan 1, 2012
Maximum:
147.952
jan 1, 1986
At the date of observation
Value
Absolute change
Change from previous value
jan 1, 1971
126.189
+126.189
0.0%
jan 1, 1972
130.154
+3.965
3.14%
jan 1, 1973
131.275
+1.121
0.86%
jan 1, 1974
134.667
+3.392
2.58%
jan 1, 1975
134.23
-0.437
-0.32%
jan 1, 1976
120.762
-13.468
-10.03%
jan 1, 1977
122.663
+1.901
1.57%
jan 1, 1978
123.298
+0.635
0.52%
jan 1, 1979
128.318
+5.021
4.07%
jan 1, 1980
134.254
+5.936
4.63%
jan 1, 1981
129.154
-5.1
-3.8%
jan 1, 1982
124.525
-4.629
-3.58%
jan 1, 1983
133.445
+8.92
7.16%
jan 1, 1984
126.245
-7.2
-5.4%
jan 1, 1985
137.88
+11.636
9.22%
jan 1, 1986
147.952
+10.071
7.3%
jan 1, 1987
126.6
-21.352
-14.43%
jan 1, 1988
127.589
+0.989
0.78%
jan 1, 1989
138.727
+11.138
8.73%
jan 1, 1990
137.299
-1.429
-1.03%
jan 1, 1991
127.099
-10.2
-7.43%
jan 1, 1992
127.809
+0.71
0.56%
jan 1, 1993
145.209
+17.401
13.61%
jan 1, 1994
123.847
-21.362
-14.71%
jan 1, 1995
117.855
-5.992
-4.84%
jan 1, 1996
123.476
+5.621
4.77%
jan 1, 1997
121.311
-2.165
-1.75%
jan 1, 1998
118.866
-2.445
-2.02%
jan 1, 1999
121.399
+2.533
2.13%
jan 1, 2000
117.955
-3.444
-2.84%
jan 1, 2001
111.362
-6.594
-5.59%
jan 1, 2002
105.628
-5.733
-5.15%
jan 1, 2003
105.518
-0.11
-0.1%
jan 1, 2004
105.912
+0.394
0.37%
jan 1, 2005
107.925
+2.013
1.9%
jan 1, 2006
108.718
+0.793
0.73%
jan 1, 2007
115.482
+6.764
6.22%
jan 1, 2008
113.762
-1.72
-1.49%
jan 1, 2009
112.982
-0.78
-0.69%
jan 1, 2010
116.281
+3.299
2.92%
jan 1, 2011
115.371
-0.91
-0.78%
jan 1, 2012
104.029
-11.342
-9.83%
jan 1, 2013
111.205
+7.176
6.9%
jan 1, 2014
107.751
-3.455
-3.11%
jan 1, 2015
112.387
+4.636
4.3%
jan 1, 2016
105.648
-6.739
-6.0%
Ranking of countries by current statistics by years


Comments: