29
/
en
AIzaSyAYiBZKx7MnpbEhh9jyipgxe19OcubqV5w
April 1, 2024
211775
Niger
NER
true
2
1
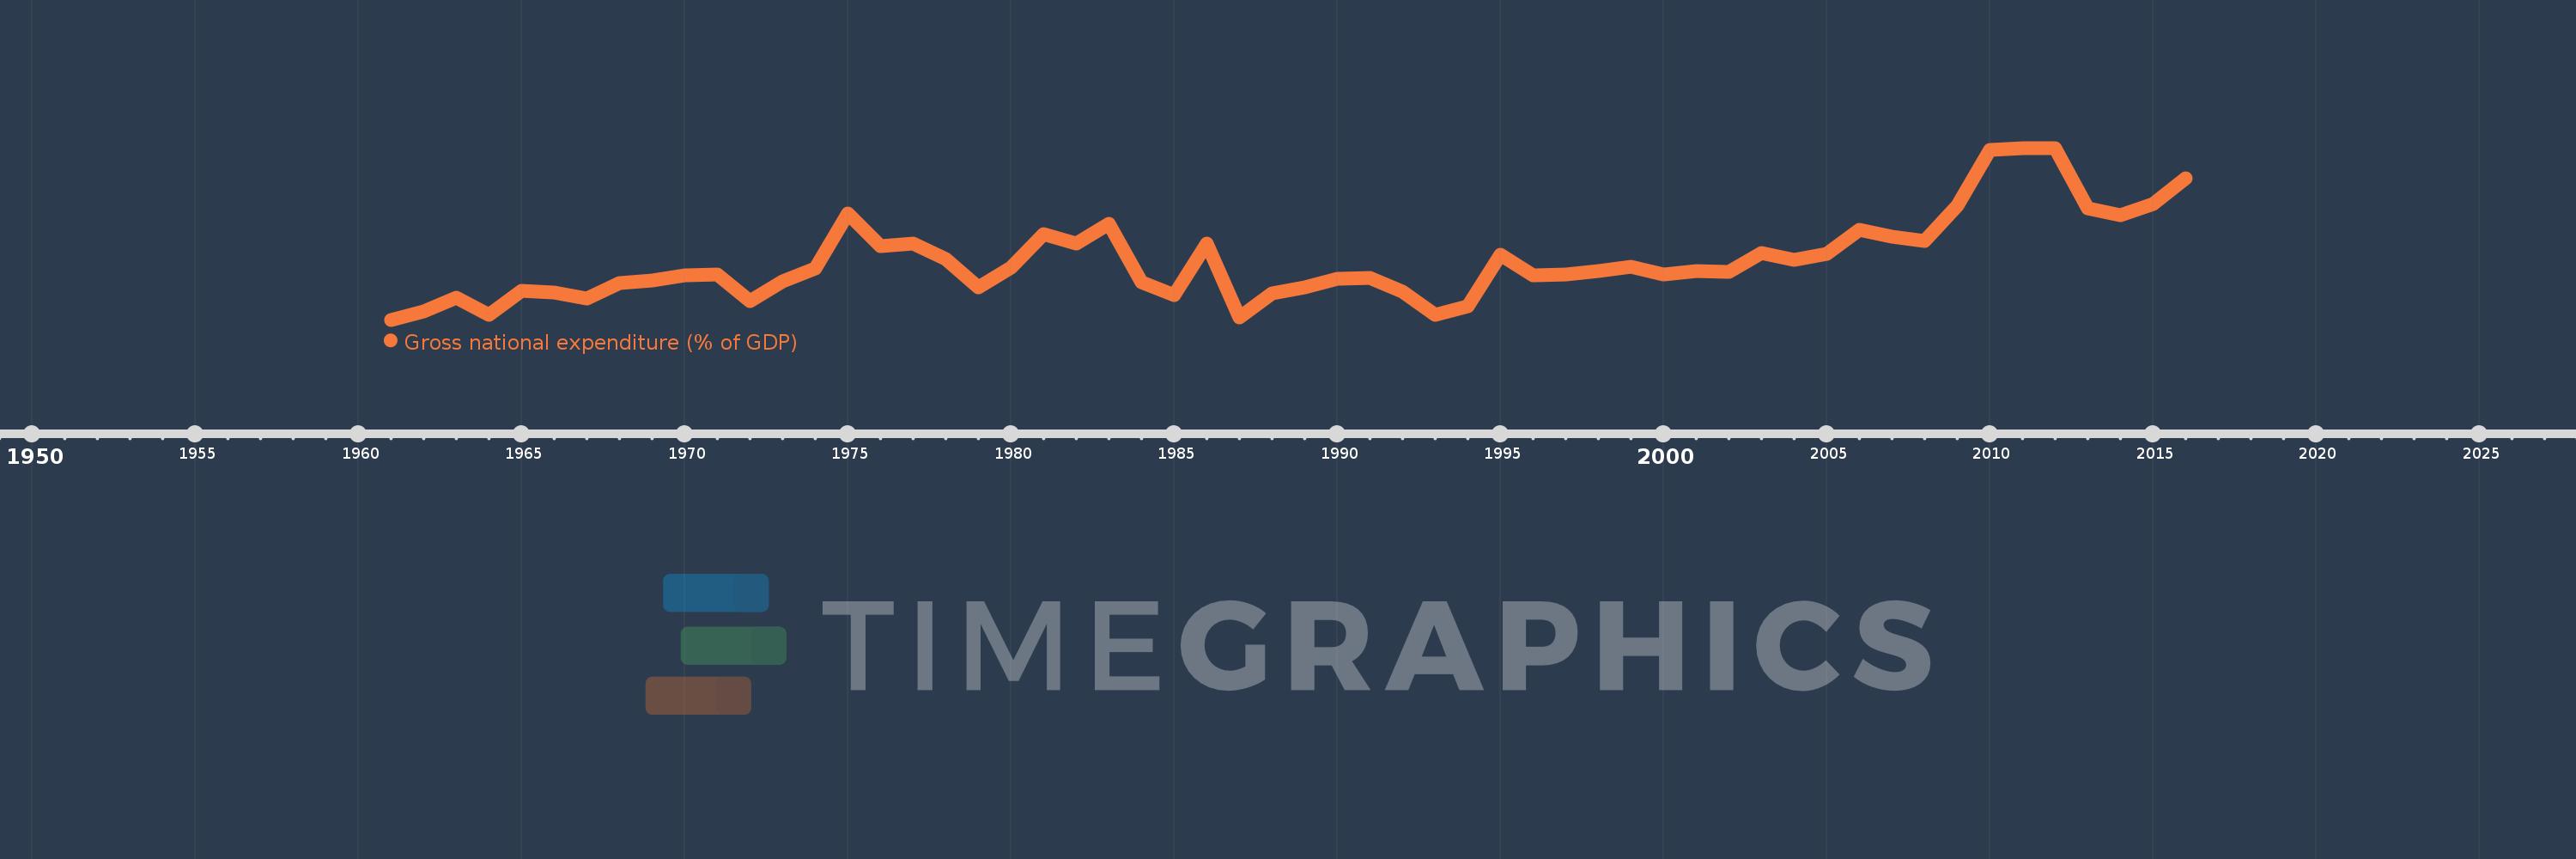
Gross national expenditure (% of GDP)
2016,2015,2014,2013,2012,2011,2010,2009,2008,2007,2006,2005,2004,2003,2002,2001,2000,1999,1998,1997,1996,1995,1994,1993,1992,1991,1990,1989,1988,1987,1986,1985,1984,1983,1982,1981,1980,1979,1978,1977,1976,1975,1974,1973,1972,1971,1970,1969,1968,1967,1966,1965,1964,1963,1962,1961
This statistics in other country:
AfghanistanAlbaniaAlgeriaAngolaAntigua and BarbudaArgentinaArmeniaArubaAustraliaAustriaAzerbaijanBahamas, TheBahrainBangladeshBarbadosBelarusBelgiumBelizeBeninBermudaBhutanBoliviaBosnia and HerzegovinaBotswanaBrazilBrunei DarussalamBulgariaBurkina FasoBurundiCabo VerdeCambodiaCameroonCanadaCentral African RepublicChadChileChinaColombiaComorosCongo, Dem. Rep.Congo, Rep.Costa RicaCote d'IvoireCroatiaCubaCyprusCzech RepublicDenmarkDjiboutiDominicaDominican RepublicEcuadorEgypt, Arab Rep.El SalvadorEquatorial GuineaEritreaEstoniaEthiopiaFaroe IslandsFijiFinlandFranceGabonGambia, TheGeorgiaGermanyGhanaGreeceGrenadaGuatemalaGuineaGuinea-BissauGuyanaHaitiHondurasHong Kong SAR, ChinaHungaryIcelandIndiaIndonesiaIran, Islamic Rep.IraqIrelandIsraelItalyJamaicaJapanJordanKazakhstanKenyaKiribatiKorea, Rep.KosovoKuwaitKyrgyz RepublicLao PDRLatviaLebanonLesothoLiberiaLibyaLithuaniaLuxembourgMacao SAR, ChinaMacedonia, FYRMadagascarMalawiMalaysiaMaldivesMaliMaltaMauritaniaMauritiusMexicoMicronesia, Fed. Sts.MoldovaMongoliaMontenegroMoroccoMozambiqueNamibiaNepalNetherlandsNew CaledoniaNew ZealandNicaraguaNigerNigeriaNorwayOmanPakistanPanamaPapua New GuineaParaguayPeruPhilippinesPolandPortugalPuerto RicoQatarRomaniaRussian FederationRwandaSaudi ArabiaSenegalSerbiaSeychellesSierra LeoneSingaporeSlovak RepublicSloveniaSolomon IslandsSomaliaSouth AfricaSouth SudanSpainSri LankaSt. Kitts and NevisSt. LuciaSt. Vincent and the GrenadinesSudanSurinameSwazilandSwedenSwitzerlandSyrian Arab RepublicTajikistanTanzaniaThailandTimor-LesteTogoTongaTrinidad and TobagoTunisiaTurkeyTurkmenistanUgandaUkraineUnited Arab EmiratesUnited KingdomUnited StatesUruguayUzbekistanVanuatuVenezuela, RBVietnamWest Bank and GazaYemen, Rep.ZambiaZimbabwe Timeline:
This timeline shows a graph from 1961 to 2016 of Niger. No data until 1960. Number of actual observations by date: 56.
Source name:
World Development Indicators
Source organization:
World Bank national accounts data, and OECD National Accounts data files.
Categories, topics:
Economy & Growth
Last updated:
apr 23, 2017
Indicators value changes by year
Minimum:
100.305
jan 1, 1961
Maximum:
126.894
jan 1, 2011
At the date of observation
Value
Absolute change
Change from previous value
jan 1, 1961
100.305
+100.305
0.0%
jan 1, 1962
101.584
+1.279
1.28%
jan 1, 1963
103.664
+2.08
2.05%
jan 1, 1964
101.011
-2.653
-2.56%
jan 1, 1965
104.832
+3.821
3.78%
jan 1, 1966
104.531
-0.301
-0.29%
jan 1, 1967
103.633
-0.898
-0.86%
jan 1, 1968
105.945
+2.312
2.23%
jan 1, 1969
106.335
+0.39
0.37%
jan 1, 1970
107.115
+0.78
0.73%
jan 1, 1971
107.328
+0.213
0.2%
jan 1, 1972
103.233
-4.095
-3.82%
jan 1, 1973
106.281
+3.048
2.95%
jan 1, 1974
108.22
+1.939
1.82%
jan 1, 1975
116.702
+8.482
7.84%
jan 1, 1976
111.747
-4.955
-4.25%
jan 1, 1977
112.074
+0.327
0.29%
jan 1, 1978
109.687
-2.387
-2.13%
jan 1, 1979
105.298
-4.389
-4.0%
jan 1, 1980
108.33
+3.032
2.88%
jan 1, 1981
113.542
+5.212
4.81%
jan 1, 1982
112.046
-1.496
-1.32%
jan 1, 1983
115.127
+3.081
2.75%
jan 1, 1984
106.089
-9.038
-7.85%
jan 1, 1985
104.065
-2.024
-1.91%
jan 1, 1986
112.155
+8.09
7.77%
jan 1, 1987
100.691
-11.463
-10.22%
jan 1, 1988
104.379
+3.687
3.66%
jan 1, 1989
105.289
+0.91
0.87%
jan 1, 1990
106.699
+1.41
1.34%
jan 1, 1991
106.791
+0.092
0.09%
jan 1, 1992
104.677
-2.114
-1.98%
jan 1, 1993
101.082
-3.595
-3.43%
jan 1, 1994
102.455
+1.374
1.36%
jan 1, 1995
110.348
+7.892
7.7%
jan 1, 1996
107.115
-3.233
-2.93%
jan 1, 1997
107.317
+0.202
0.19%
jan 1, 1998
107.817
+0.5
0.47%
jan 1, 1999
108.538
+0.721
0.67%
jan 1, 2000
107.333
-1.205
-1.11%
jan 1, 2001
107.893
+0.56
0.52%
jan 1, 2002
107.688
-0.204
-0.19%
jan 1, 2003
110.578
+2.889
2.68%
jan 1, 2004
109.588
-0.989
-0.89%
jan 1, 2005
110.542
+0.953
0.87%
jan 1, 2006
114.205
+3.663
3.31%
jan 1, 2007
113.097
-1.108
-0.97%
jan 1, 2008
112.498
-0.599
-0.53%
jan 1, 2009
117.957
+5.46
4.85%
jan 1, 2010
126.535
+8.578
7.27%
jan 1, 2011
126.894
+0.359
0.28%
jan 1, 2012
126.884
-0.009
-0.01%
jan 1, 2013
117.503
-9.382
-7.39%
jan 1, 2014
116.445
-1.057
-0.9%
jan 1, 2015
118.222
+1.777
1.53%
jan 1, 2016
122.263
+4.041
3.42%
Ranking of countries by current statistics by years


Comments: