29
/
en
AIzaSyAYiBZKx7MnpbEhh9jyipgxe19OcubqV5w
April 1, 2024
86671
Bhutan
BTN
true
2
1
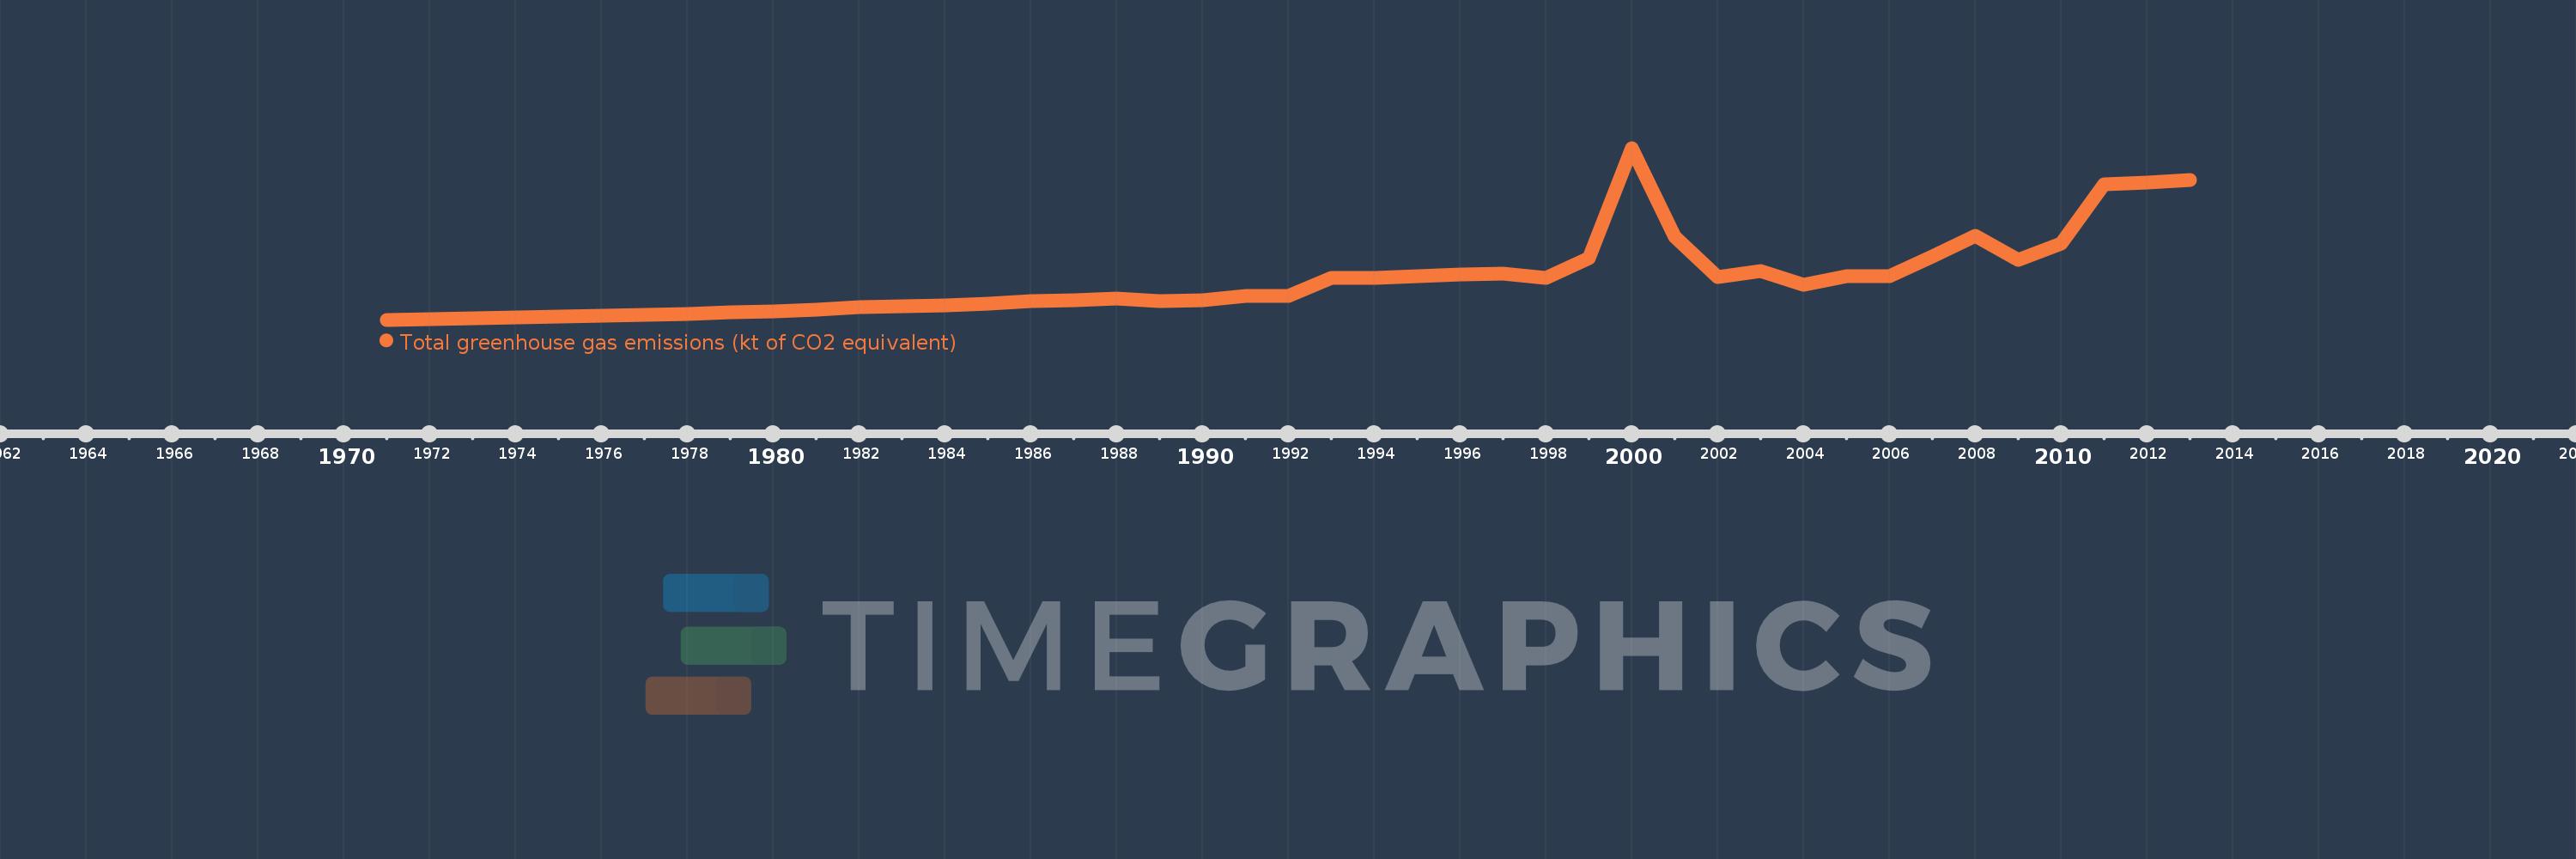
Total greenhouse gas emissions (kt of CO2 equivalent)
2013,2012,2011,2010,2009,2008,2007,2006,2005,2004,2003,2002,2001,2000,1999,1998,1997,1996,1995,1994,1993,1992,1991,1990,1989,1988,1987,1986,1985,1984,1983,1982,1981,1980,1979,1978,1977,1976,1975,1974,1973,1972,1971
This statistics in other country:
AfghanistanAlbaniaAlgeriaAmerican SamoaAngolaAntigua and BarbudaArab WorldArgentinaArmeniaArubaAustraliaAustriaAzerbaijanBahamas, TheBahrainBangladeshBarbadosBelarusBelgiumBelizeBeninBermudaBhutanBoliviaBosnia and HerzegovinaBotswanaBrazilBritish Virgin IslandsBrunei DarussalamBulgariaBurkina FasoBurundiCabo VerdeCambodiaCameroonCanadaCaribbean small statesCayman IslandsCentral African RepublicCentral Europe and the BalticsChadChileChinaColombiaComorosCongo, Dem. Rep.Congo, Rep.Costa RicaCote d'IvoireCroatiaCubaCyprusCzech RepublicDenmarkDjiboutiDominicaDominican RepublicEarly-demographic dividendEast Asia & PacificEast Asia & Pacific (excluding high income)East Asia & Pacific (IDA & IBRD countries)EcuadorEgypt, Arab Rep.El SalvadorEquatorial GuineaEritreaEstoniaEthiopiaEuro areaEurope & Central AsiaEurope & Central Asia (excluding high income)Europe & Central Asia (IDA & IBRD countries)European UnionFijiFinlandFragile and conflict affected situationsFranceFrench PolynesiaGabonGambia, TheGeorgiaGermanyGhanaGibraltarGreeceGrenadaGuamGuatemalaGuineaGuinea-BissauGuyanaHaitiHeavily indebted poor countries (HIPC)High incomeHondurasHong Kong SAR, ChinaHungaryIBRD onlyIcelandIDA & IBRD totalIDA blendIDA onlyIDA totalIndiaIndonesiaIran, Islamic Rep.IraqIrelandIsraelItalyJamaicaJapanJordanKazakhstanKenyaKiribatiKorea, Dem. People’s Rep.Korea, Rep.KuwaitKyrgyz RepublicLao PDRLate-demographic dividendLatin America & Caribbean Latin America & Caribbean (excluding high income)Latin America & the Caribbean (IDA & IBRD countries)LatviaLeast developed countries: UN classificationLebanonLesothoLiberiaLibyaLithuaniaLow & middle incomeLow incomeLower middle incomeLuxembourgMacao SAR, ChinaMacedonia, FYRMadagascarMalawiMalaysiaMaldivesMaliMaltaMarshall IslandsMauritaniaMauritiusMexicoMicronesia, Fed. Sts.Middle East & North AfricaMiddle East & North Africa (excluding high income)Middle East & North Africa (IDA & IBRD countries)Middle incomeMoldovaMongoliaMoroccoMozambiqueMyanmarNamibiaNepalNetherlandsNew CaledoniaNew ZealandNicaraguaNigerNigeriaNorth AmericaNorthern Mariana IslandsNorwayOECD membersOmanOther small statesPacific island small statesPakistanPanamaPapua New GuineaParaguayPeruPhilippinesPolandPortugalPost-demographic dividendPre-demographic dividendPuerto RicoQatarRomaniaRussian FederationRwandaSamoaSao Tome and PrincipeSaudi ArabiaSenegalSeychellesSierra LeoneSingaporeSlovak RepublicSloveniaSmall statesSolomon IslandsSomaliaSouth AfricaSouth AsiaSouth Asia (IDA & IBRD)SpainSri LankaSt. Kitts and NevisSt. LuciaSt. Vincent and the GrenadinesSub-Saharan Africa Sub-Saharan Africa (excluding high income)Sub-Saharan Africa (IDA & IBRD countries)SudanSurinameSwazilandSwedenSwitzerlandSyrian Arab RepublicTajikistanTanzaniaThailandTimor-LesteTogoTongaTrinidad and TobagoTunisiaTurkeyTurkmenistanTurks and Caicos IslandsTuvaluUgandaUkraineUnited Arab EmiratesUnited KingdomUnited StatesUpper middle incomeUruguayUzbekistanVanuatuVenezuela, RBVietnamVirgin Islands (U.S.)WorldYemen, Rep.ZambiaZimbabwe Timeline:
This timeline shows a graph from 1971 to 2013 of Bhutan. No data until 1970. Number of actual observations by date: 43.
Source name:
World Development Indicators
Source organization:
European Commission, Joint Research Centre (JRC)/Netherlands Environmental Assessment Agency (PBL). Emission Database for Global Atmospheric Research (EDGAR), EDGARv4.2 FT2012: http://edgar.jrc.ec.europa.eu/
Categories, topics:
Climate Change, Environment
Last updated:
apr 23, 2017
Indicators value changes by year
Minimum:
862.693
jan 1, 1971
Maximum:
3.858K
jan 1, 2000
At the date of observation
Value
Absolute change
Change from previous value
jan 1, 1971
862.693
+862.693
0.0%
jan 1, 1972
876.689
+13.996
1.62%
jan 1, 1973
891.392
+14.703
1.68%
jan 1, 1974
909.185
+17.793
2.0%
jan 1, 1975
925.136
+15.95
1.75%
jan 1, 1976
930.872
+5.736
0.62%
jan 1, 1977
944.801
+13.929
1.5%
jan 1, 1978
963.676
+18.875
2.0%
jan 1, 1979
993.853
+30.177
3.13%
jan 1, 1980
1.014K
+20.254
2.04%
jan 1, 1981
1.035K
+21.342
2.1%
jan 1, 1982
1.086K
+50.281
4.86%
jan 1, 1983
1.095K
+9.437
0.87%
jan 1, 1984
1.119K
+23.728
2.17%
jan 1, 1985
1.14K
+21.53
1.92%
jan 1, 1986
1.187K
+46.567
4.08%
jan 1, 1987
1.201K
+14.452
1.22%
jan 1, 1988
1.227K
+25.715
2.14%
jan 1, 1989
1.188K
-38.989
-3.18%
jan 1, 1990
1.196K
+7.892
0.66%
jan 1, 1991
1.28K
+84.08
7.03%
jan 1, 1992
1.277K
-3.227
-0.25%
jan 1, 1993
1.595K
+318.062
24.91%
jan 1, 1994
1.592K
-2.723
-0.17%
jan 1, 1995
1.615K
+22.415
1.41%
jan 1, 1996
1.648K
+33.218
2.06%
jan 1, 1997
1.664K
+16.045
0.97%
jan 1, 1998
1.597K
-66.83
-4.02%
jan 1, 1999
1.943K
+345.982
21.66%
jan 1, 2000
3.858K
+1.914K
98.53%
jan 1, 2001
2.31K
-1.548K
-40.12%
jan 1, 2002
1.613K
-696.288
-30.15%
jan 1, 2003
1.708K
+94.127
5.83%
jan 1, 2004
1.468K
-240.027
-14.06%
jan 1, 2005
1.623K
+155.669
10.61%
jan 1, 2006
1.618K
-5.378
-0.33%
jan 1, 2007
1.966K
+348.489
21.54%
jan 1, 2008
2.327K
+360.199
18.32%
jan 1, 2009
1.908K
-418.267
-17.98%
jan 1, 2010
2.191K
+282.634
14.81%
jan 1, 2011
3.22K
+1.029K
46.99%
jan 1, 2012
3.26K
+39.207
1.22%
jan 1, 2013
3.297K
+37.356
1.15%
Ranking of countries by current statistics by years


Comments: