29
/
en
AIzaSyAYiBZKx7MnpbEhh9jyipgxe19OcubqV5w
April 1, 2024
224404
Philippines
PHL
true
2
1
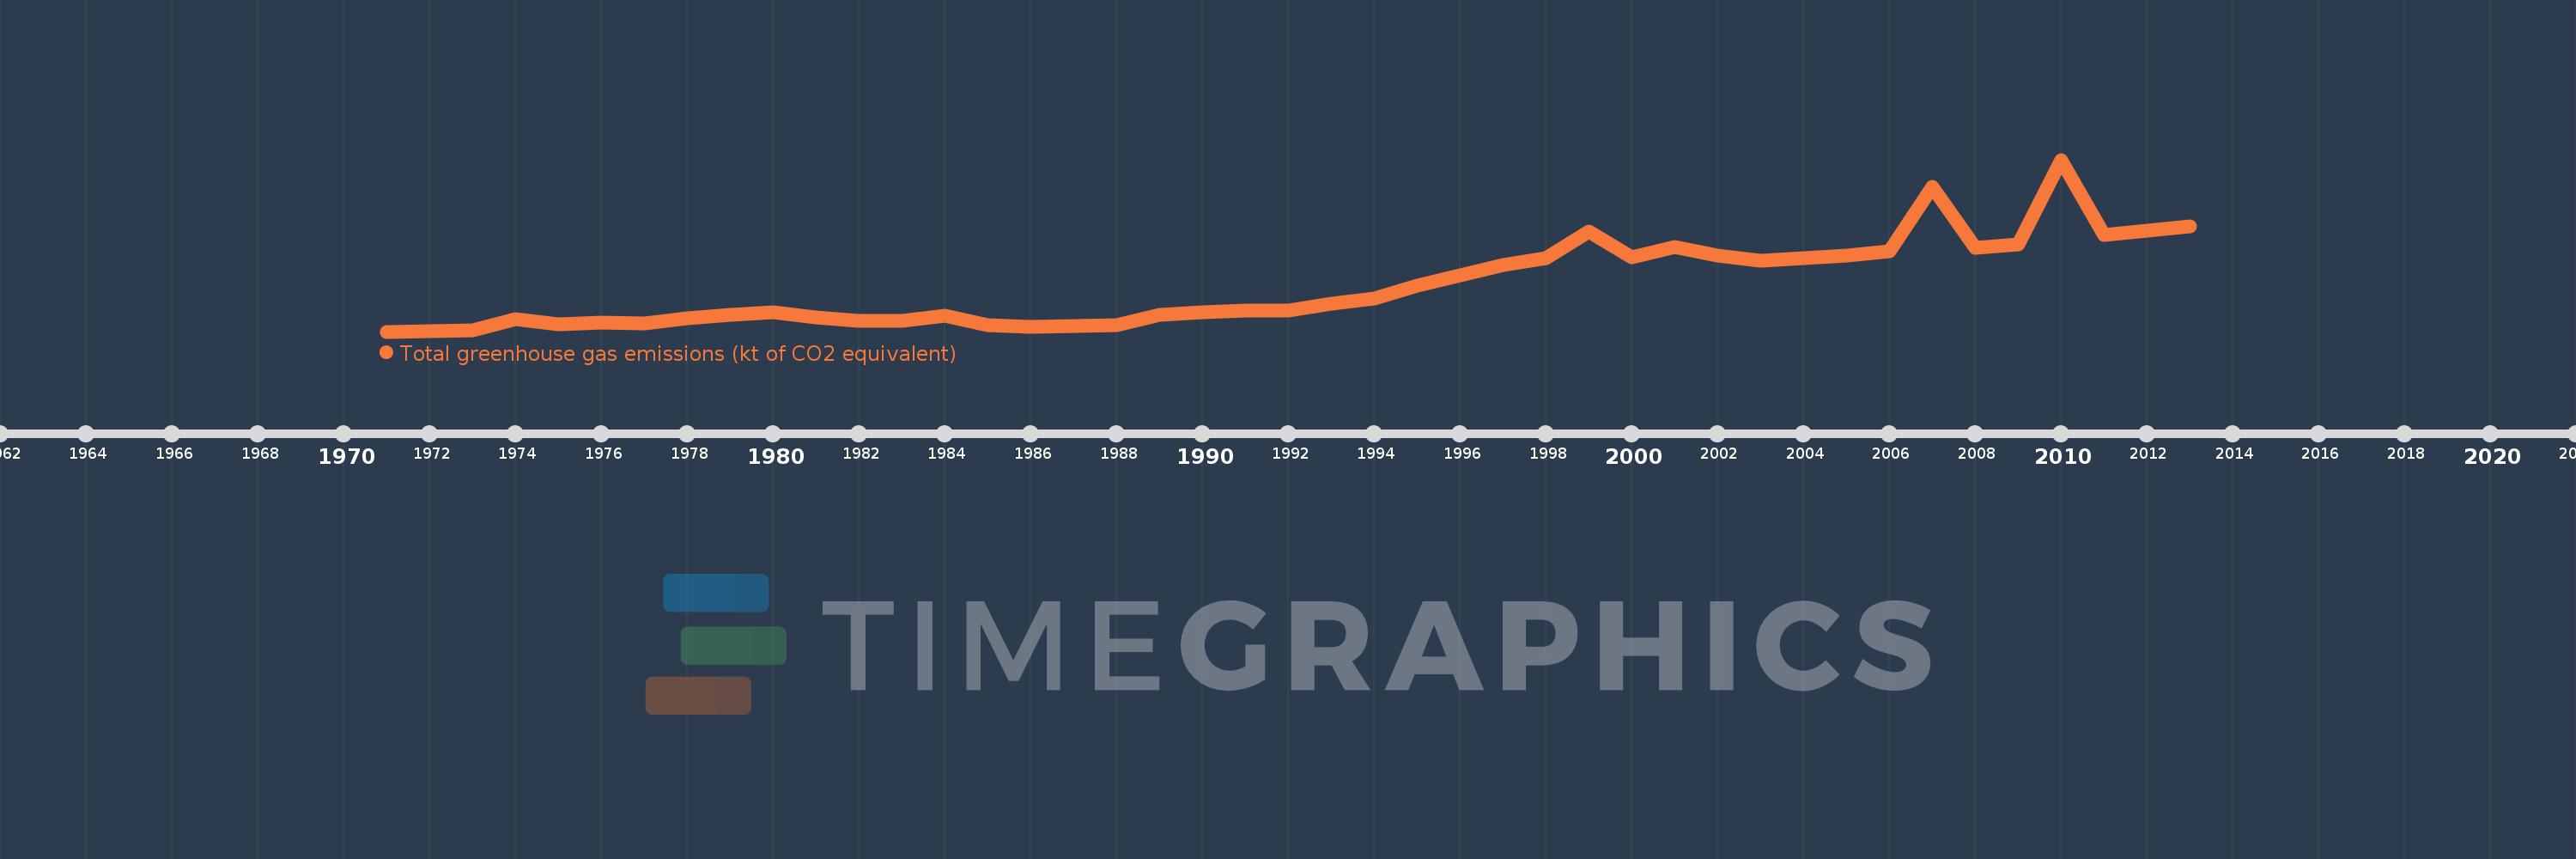
Total greenhouse gas emissions (kt of CO2 equivalent)
2013,2012,2011,2010,2009,2008,2007,2006,2005,2004,2003,2002,2001,2000,1999,1998,1997,1996,1995,1994,1993,1992,1991,1990,1989,1988,1987,1986,1985,1984,1983,1982,1981,1980,1979,1978,1977,1976,1975,1974,1973,1972,1971
This statistics in other country:
AfghanistanAlbaniaAlgeriaAmerican SamoaAngolaAntigua and BarbudaArab WorldArgentinaArmeniaArubaAustraliaAustriaAzerbaijanBahamas, TheBahrainBangladeshBarbadosBelarusBelgiumBelizeBeninBermudaBhutanBoliviaBosnia and HerzegovinaBotswanaBrazilBritish Virgin IslandsBrunei DarussalamBulgariaBurkina FasoBurundiCabo VerdeCambodiaCameroonCanadaCaribbean small statesCayman IslandsCentral African RepublicCentral Europe and the BalticsChadChileChinaColombiaComorosCongo, Dem. Rep.Congo, Rep.Costa RicaCote d'IvoireCroatiaCubaCyprusCzech RepublicDenmarkDjiboutiDominicaDominican RepublicEarly-demographic dividendEast Asia & PacificEast Asia & Pacific (excluding high income)East Asia & Pacific (IDA & IBRD countries)EcuadorEgypt, Arab Rep.El SalvadorEquatorial GuineaEritreaEstoniaEthiopiaEuro areaEurope & Central AsiaEurope & Central Asia (excluding high income)Europe & Central Asia (IDA & IBRD countries)European UnionFijiFinlandFragile and conflict affected situationsFranceFrench PolynesiaGabonGambia, TheGeorgiaGermanyGhanaGibraltarGreeceGrenadaGuamGuatemalaGuineaGuinea-BissauGuyanaHaitiHeavily indebted poor countries (HIPC)High incomeHondurasHong Kong SAR, ChinaHungaryIBRD onlyIcelandIDA & IBRD totalIDA blendIDA onlyIDA totalIndiaIndonesiaIran, Islamic Rep.IraqIrelandIsraelItalyJamaicaJapanJordanKazakhstanKenyaKiribatiKorea, Dem. People’s Rep.Korea, Rep.KuwaitKyrgyz RepublicLao PDRLate-demographic dividendLatin America & Caribbean Latin America & Caribbean (excluding high income)Latin America & the Caribbean (IDA & IBRD countries)LatviaLeast developed countries: UN classificationLebanonLesothoLiberiaLibyaLithuaniaLow & middle incomeLow incomeLower middle incomeLuxembourgMacao SAR, ChinaMacedonia, FYRMadagascarMalawiMalaysiaMaldivesMaliMaltaMarshall IslandsMauritaniaMauritiusMexicoMicronesia, Fed. Sts.Middle East & North AfricaMiddle East & North Africa (excluding high income)Middle East & North Africa (IDA & IBRD countries)Middle incomeMoldovaMongoliaMoroccoMozambiqueMyanmarNamibiaNepalNetherlandsNew CaledoniaNew ZealandNicaraguaNigerNigeriaNorth AmericaNorthern Mariana IslandsNorwayOECD membersOmanOther small statesPacific island small statesPakistanPanamaPapua New GuineaParaguayPeruPhilippinesPolandPortugalPost-demographic dividendPre-demographic dividendPuerto RicoQatarRomaniaRussian FederationRwandaSamoaSao Tome and PrincipeSaudi ArabiaSenegalSeychellesSierra LeoneSingaporeSlovak RepublicSloveniaSmall statesSolomon IslandsSomaliaSouth AfricaSouth AsiaSouth Asia (IDA & IBRD)SpainSri LankaSt. Kitts and NevisSt. LuciaSt. Vincent and the GrenadinesSub-Saharan Africa Sub-Saharan Africa (excluding high income)Sub-Saharan Africa (IDA & IBRD countries)SudanSurinameSwazilandSwedenSwitzerlandSyrian Arab RepublicTajikistanTanzaniaThailandTimor-LesteTogoTongaTrinidad and TobagoTunisiaTurkeyTurkmenistanTurks and Caicos IslandsTuvaluUgandaUkraineUnited Arab EmiratesUnited KingdomUnited StatesUpper middle incomeUruguayUzbekistanVanuatuVenezuela, RBVietnamVirgin Islands (U.S.)WorldYemen, Rep.ZambiaZimbabwe Timeline:
This timeline shows a graph from 1971 to 2013 of Philippines. No data until 1970. Number of actual observations by date: 43.
Source name:
World Development Indicators
Source organization:
European Commission, Joint Research Centre (JRC)/Netherlands Environmental Assessment Agency (PBL). Emission Database for Global Atmospheric Research (EDGAR), EDGARv4.2 FT2012: http://edgar.jrc.ec.europa.eu/
Categories, topics:
Climate Change, Environment
Last updated:
apr 23, 2017
Indicators value changes by year
Minimum:
78.221K
jan 1, 1971
Maximum:
223.801K
jan 1, 2010
At the date of observation
Value
Absolute change
Change from previous value
jan 1, 1971
78.221K
+78.221K
0.0%
jan 1, 1972
78.563K
+342.544
0.44%
jan 1, 1973
79.528K
+964.445
1.23%
jan 1, 1974
88.767K
+9.24K
11.62%
jan 1, 1975
84.178K
-4.589K
-5.17%
jan 1, 1976
85.573K
+1.394K
1.66%
jan 1, 1977
84.879K
-694.273
-0.81%
jan 1, 1978
89.722K
+4.843K
5.71%
jan 1, 1979
92.112K
+2.39K
2.66%
jan 1, 1980
94.616K
+2.504K
2.72%
jan 1, 1981
90.455K
-4.161K
-4.4%
jan 1, 1982
87.094K
-3.361K
-3.72%
jan 1, 1983
87.028K
-66.786
-0.08%
jan 1, 1984
91.682K
+4.655K
5.35%
jan 1, 1985
83.765K
-7.917K
-8.64%
jan 1, 1986
82.498K
-1.267K
-1.51%
jan 1, 1987
82.668K
+169.274
0.21%
jan 1, 1988
83.709K
+1.041K
1.26%
jan 1, 1989
92.301K
+8.592K
10.26%
jan 1, 1990
94.618K
+2.317K
2.51%
jan 1, 1991
96.355K
+1.737K
1.84%
jan 1, 1992
96.239K
-116.12
-0.12%
jan 1, 1993
102.098K
+5.859K
6.09%
jan 1, 1994
106.303K
+4.205K
4.12%
jan 1, 1995
117.252K
+10.949K
10.3%
jan 1, 1996
125.623K
+8.371K
7.14%
jan 1, 1997
134.297K
+8.673K
6.9%
jan 1, 1998
140.736K
+6.44K
4.8%
jan 1, 1999
163.224K
+22.488K
15.98%
jan 1, 2000
140.842K
-22.382K
-13.71%
jan 1, 2001
150.079K
+9.237K
6.56%
jan 1, 2002
142.869K
-7.21K
-4.8%
jan 1, 2003
138.051K
-4.818K
-3.37%
jan 1, 2004
140.443K
+2.392K
1.73%
jan 1, 2005
142.979K
+2.536K
1.81%
jan 1, 2006
146.434K
+3.455K
2.42%
jan 1, 2007
201.211K
+54.778K
37.41%
jan 1, 2008
149.106K
-52.105K
-25.9%
jan 1, 2009
152.332K
+3.226K
2.16%
jan 1, 2010
223.801K
+71.469K
46.92%
jan 1, 2011
159.94K
-63.861K
-28.53%
jan 1, 2012
163.798K
+3.857K
2.41%
jan 1, 2013
167.298K
+3.5K
2.14%
Ranking of countries by current statistics by years


Comments: