29
/
en
AIzaSyAYiBZKx7MnpbEhh9jyipgxe19OcubqV5w
April 1, 2024
266409
Tonga
TON
true
2
1
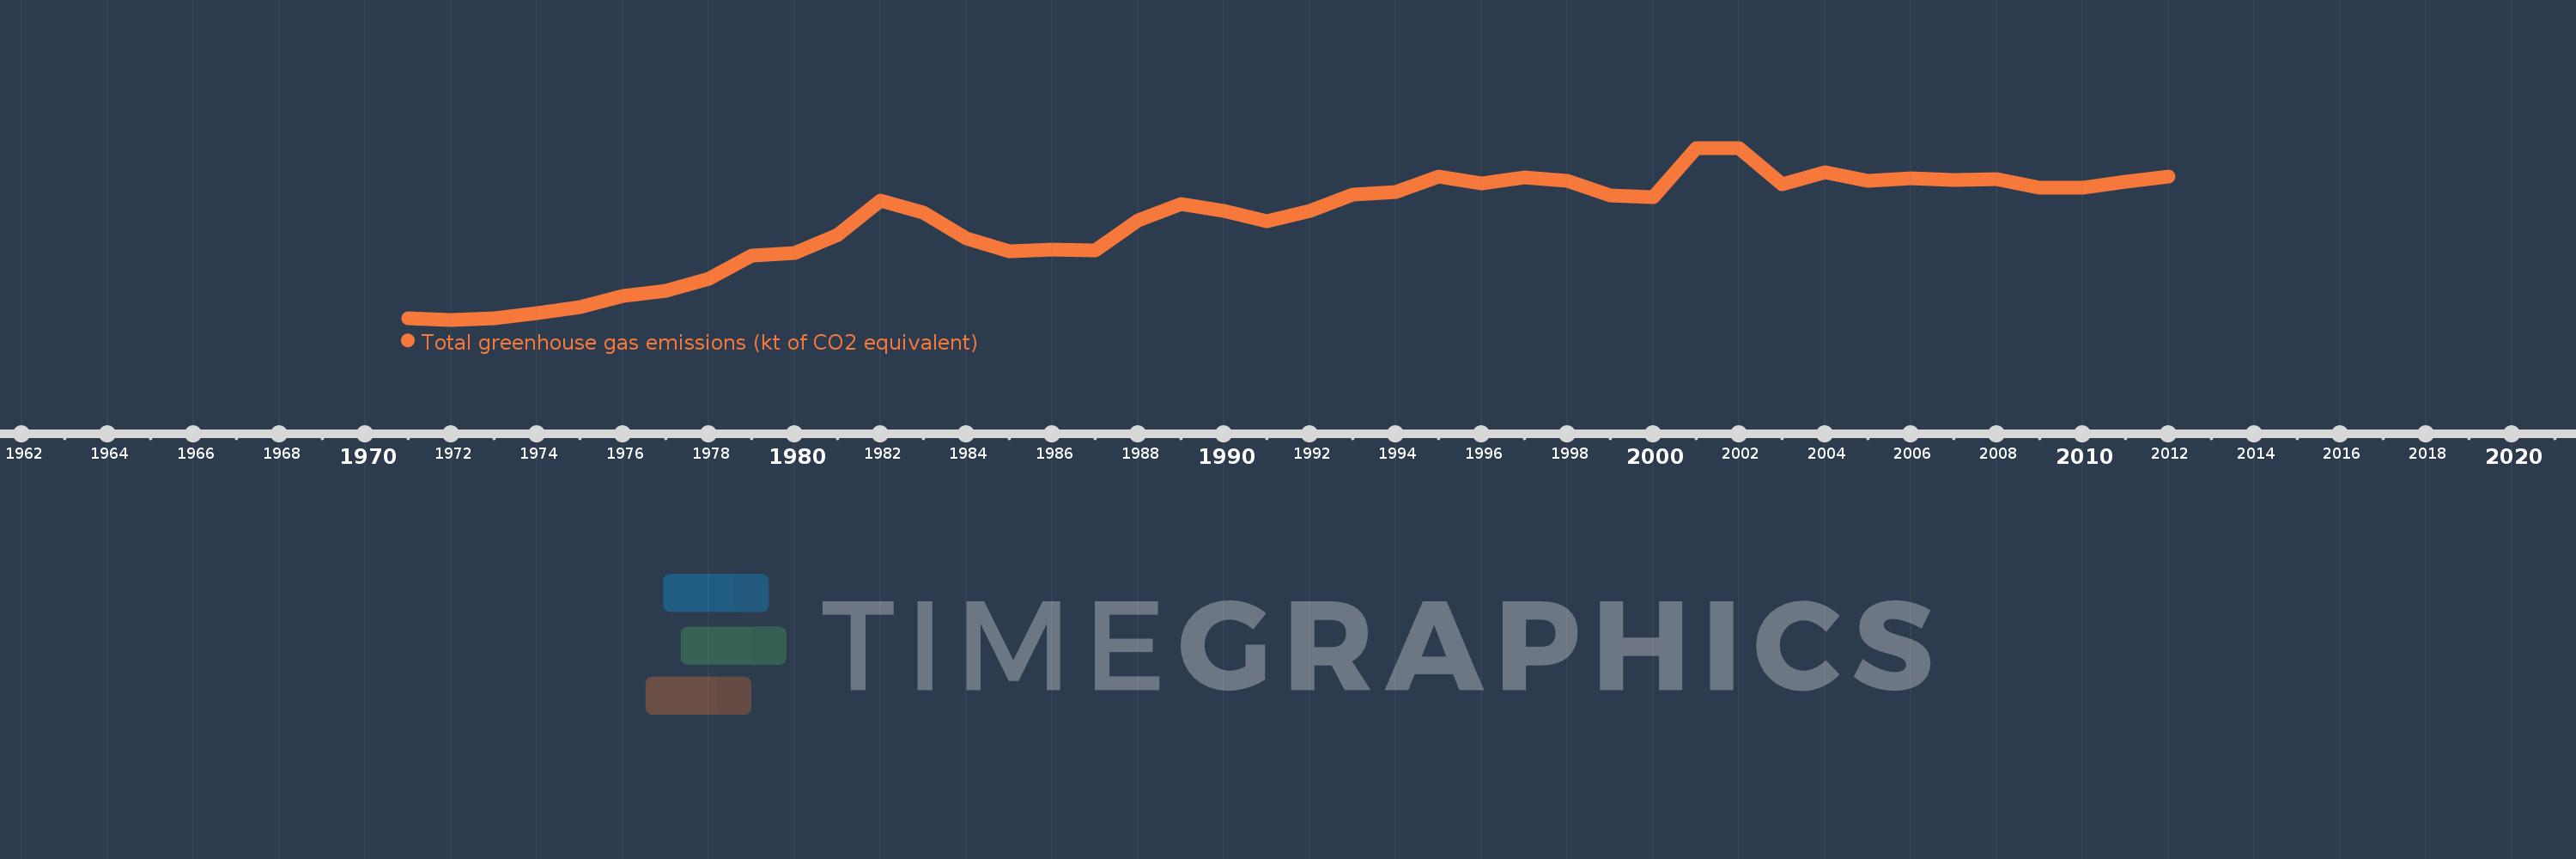
Total greenhouse gas emissions (kt of CO2 equivalent)
2012,2011,2010,2009,2008,2007,2006,2005,2004,2003,2002,2001,2000,1999,1998,1997,1996,1995,1994,1993,1992,1991,1990,1989,1988,1987,1986,1985,1984,1983,1982,1981,1980,1979,1978,1977,1976,1975,1974,1973,1972,1971
This statistics in other country:
AfghanistanAlbaniaAlgeriaAmerican SamoaAngolaAntigua and BarbudaArab WorldArgentinaArmeniaArubaAustraliaAustriaAzerbaijanBahamas, TheBahrainBangladeshBarbadosBelarusBelgiumBelizeBeninBermudaBhutanBoliviaBosnia and HerzegovinaBotswanaBrazilBritish Virgin IslandsBrunei DarussalamBulgariaBurkina FasoBurundiCabo VerdeCambodiaCameroonCanadaCaribbean small statesCayman IslandsCentral African RepublicCentral Europe and the BalticsChadChileChinaColombiaComorosCongo, Dem. Rep.Congo, Rep.Costa RicaCote d'IvoireCroatiaCubaCyprusCzech RepublicDenmarkDjiboutiDominicaDominican RepublicEarly-demographic dividendEast Asia & PacificEast Asia & Pacific (excluding high income)East Asia & Pacific (IDA & IBRD countries)EcuadorEgypt, Arab Rep.El SalvadorEquatorial GuineaEritreaEstoniaEthiopiaEuro areaEurope & Central AsiaEurope & Central Asia (excluding high income)Europe & Central Asia (IDA & IBRD countries)European UnionFijiFinlandFragile and conflict affected situationsFranceFrench PolynesiaGabonGambia, TheGeorgiaGermanyGhanaGibraltarGreeceGrenadaGuamGuatemalaGuineaGuinea-BissauGuyanaHaitiHeavily indebted poor countries (HIPC)High incomeHondurasHong Kong SAR, ChinaHungaryIBRD onlyIcelandIDA & IBRD totalIDA blendIDA onlyIDA totalIndiaIndonesiaIran, Islamic Rep.IraqIrelandIsraelItalyJamaicaJapanJordanKazakhstanKenyaKiribatiKorea, Dem. People’s Rep.Korea, Rep.KuwaitKyrgyz RepublicLao PDRLate-demographic dividendLatin America & Caribbean Latin America & Caribbean (excluding high income)Latin America & the Caribbean (IDA & IBRD countries)LatviaLeast developed countries: UN classificationLebanonLesothoLiberiaLibyaLithuaniaLow & middle incomeLow incomeLower middle incomeLuxembourgMacao SAR, ChinaMacedonia, FYRMadagascarMalawiMalaysiaMaldivesMaliMaltaMarshall IslandsMauritaniaMauritiusMexicoMicronesia, Fed. Sts.Middle East & North AfricaMiddle East & North Africa (excluding high income)Middle East & North Africa (IDA & IBRD countries)Middle incomeMoldovaMongoliaMoroccoMozambiqueMyanmarNamibiaNepalNetherlandsNew CaledoniaNew ZealandNicaraguaNigerNigeriaNorth AmericaNorthern Mariana IslandsNorwayOECD membersOmanOther small statesPacific island small statesPakistanPanamaPapua New GuineaParaguayPeruPhilippinesPolandPortugalPost-demographic dividendPre-demographic dividendPuerto RicoQatarRomaniaRussian FederationRwandaSamoaSao Tome and PrincipeSaudi ArabiaSenegalSeychellesSierra LeoneSingaporeSlovak RepublicSloveniaSmall statesSolomon IslandsSomaliaSouth AfricaSouth AsiaSouth Asia (IDA & IBRD)SpainSri LankaSt. Kitts and NevisSt. LuciaSt. Vincent and the GrenadinesSub-Saharan Africa Sub-Saharan Africa (excluding high income)Sub-Saharan Africa (IDA & IBRD countries)SudanSurinameSwazilandSwedenSwitzerlandSyrian Arab RepublicTajikistanTanzaniaThailandTimor-LesteTogoTongaTrinidad and TobagoTunisiaTurkeyTurkmenistanTurks and Caicos IslandsTuvaluUgandaUkraineUnited Arab EmiratesUnited KingdomUnited StatesUpper middle incomeUruguayUzbekistanVanuatuVenezuela, RBVietnamVirgin Islands (U.S.)WorldYemen, Rep.ZambiaZimbabwe Timeline:
This timeline shows a graph from 1971 to 2012 of Tonga. No data until 1970. Number of actual observations by date: 42.
Source name:
World Development Indicators
Source organization:
European Commission, Joint Research Centre (JRC)/Netherlands Environmental Assessment Agency (PBL). Emission Database for Global Atmospheric Research (EDGAR), EDGARv4.2 FT2012: http://edgar.jrc.ec.europa.eu/
Categories, topics:
Climate Change, Environment
Last updated:
apr 23, 2017
Indicators value changes by year
Minimum:
55.626
jan 1, 1972
Maximum:
175.118
jan 1, 2001
At the date of observation
Value
Absolute change
Change from previous value
jan 1, 1971
56.637
+56.637
0.0%
jan 1, 1972
55.626
-1.011
-1.79%
jan 1, 1973
56.437
+0.812
1.46%
jan 1, 1974
60.164
+3.727
6.6%
jan 1, 1975
64.187
+4.023
6.69%
jan 1, 1976
71.969
+7.782
12.12%
jan 1, 1977
75.983
+4.014
5.58%
jan 1, 1978
83.833
+7.85
10.33%
jan 1, 1979
100.213
+16.379
19.54%
jan 1, 1980
102.326
+2.113
2.11%
jan 1, 1981
114.831
+12.505
12.22%
jan 1, 1982
138.356
+23.525
20.49%
jan 1, 1983
130.089
-8.267
-5.98%
jan 1, 1984
112.363
-17.726
-13.63%
jan 1, 1985
103.341
-9.022
-8.03%
jan 1, 1986
104.468
+1.127
1.09%
jan 1, 1987
103.788
-0.681
-0.65%
jan 1, 1988
124.805
+21.017
20.25%
jan 1, 1989
135.889
+11.085
8.88%
jan 1, 1990
131.411
-4.478
-3.3%
jan 1, 1991
124.449
-6.962
-5.3%
jan 1, 1992
131.15
+6.701
5.38%
jan 1, 1993
142.692
+11.542
8.8%
jan 1, 1994
144.247
+1.555
1.09%
jan 1, 1995
155.099
+10.852
7.52%
jan 1, 1996
150.449
-4.65
-3.0%
jan 1, 1997
154.366
+3.917
2.6%
jan 1, 1998
152.251
-2.115
-1.37%
jan 1, 1999
142.261
-9.99
-6.56%
jan 1, 2000
140.786
-1.475
-1.04%
jan 1, 2001
175.118
+34.332
24.39%
jan 1, 2002
174.842
-0.277
-0.16%
jan 1, 2003
150.112
-24.73
-14.14%
jan 1, 2004
158.061
+7.949
5.3%
jan 1, 2005
152.488
-5.573
-3.53%
jan 1, 2006
153.79
+1.302
0.85%
jan 1, 2007
152.775
-1.015
-0.66%
jan 1, 2008
153.467
+0.692
0.45%
jan 1, 2009
147.585
-5.882
-3.83%
jan 1, 2010
147.553
-0.032
-0.02%
jan 1, 2011
151.934
+4.382
2.97%
jan 1, 2012
155.291
+3.356
2.21%
Ranking of countries by current statistics by years


Comments: