29
/
en
AIzaSyAYiBZKx7MnpbEhh9jyipgxe19OcubqV5w
April 1, 2024
251469
St. Lucia
LCA
true
2
1
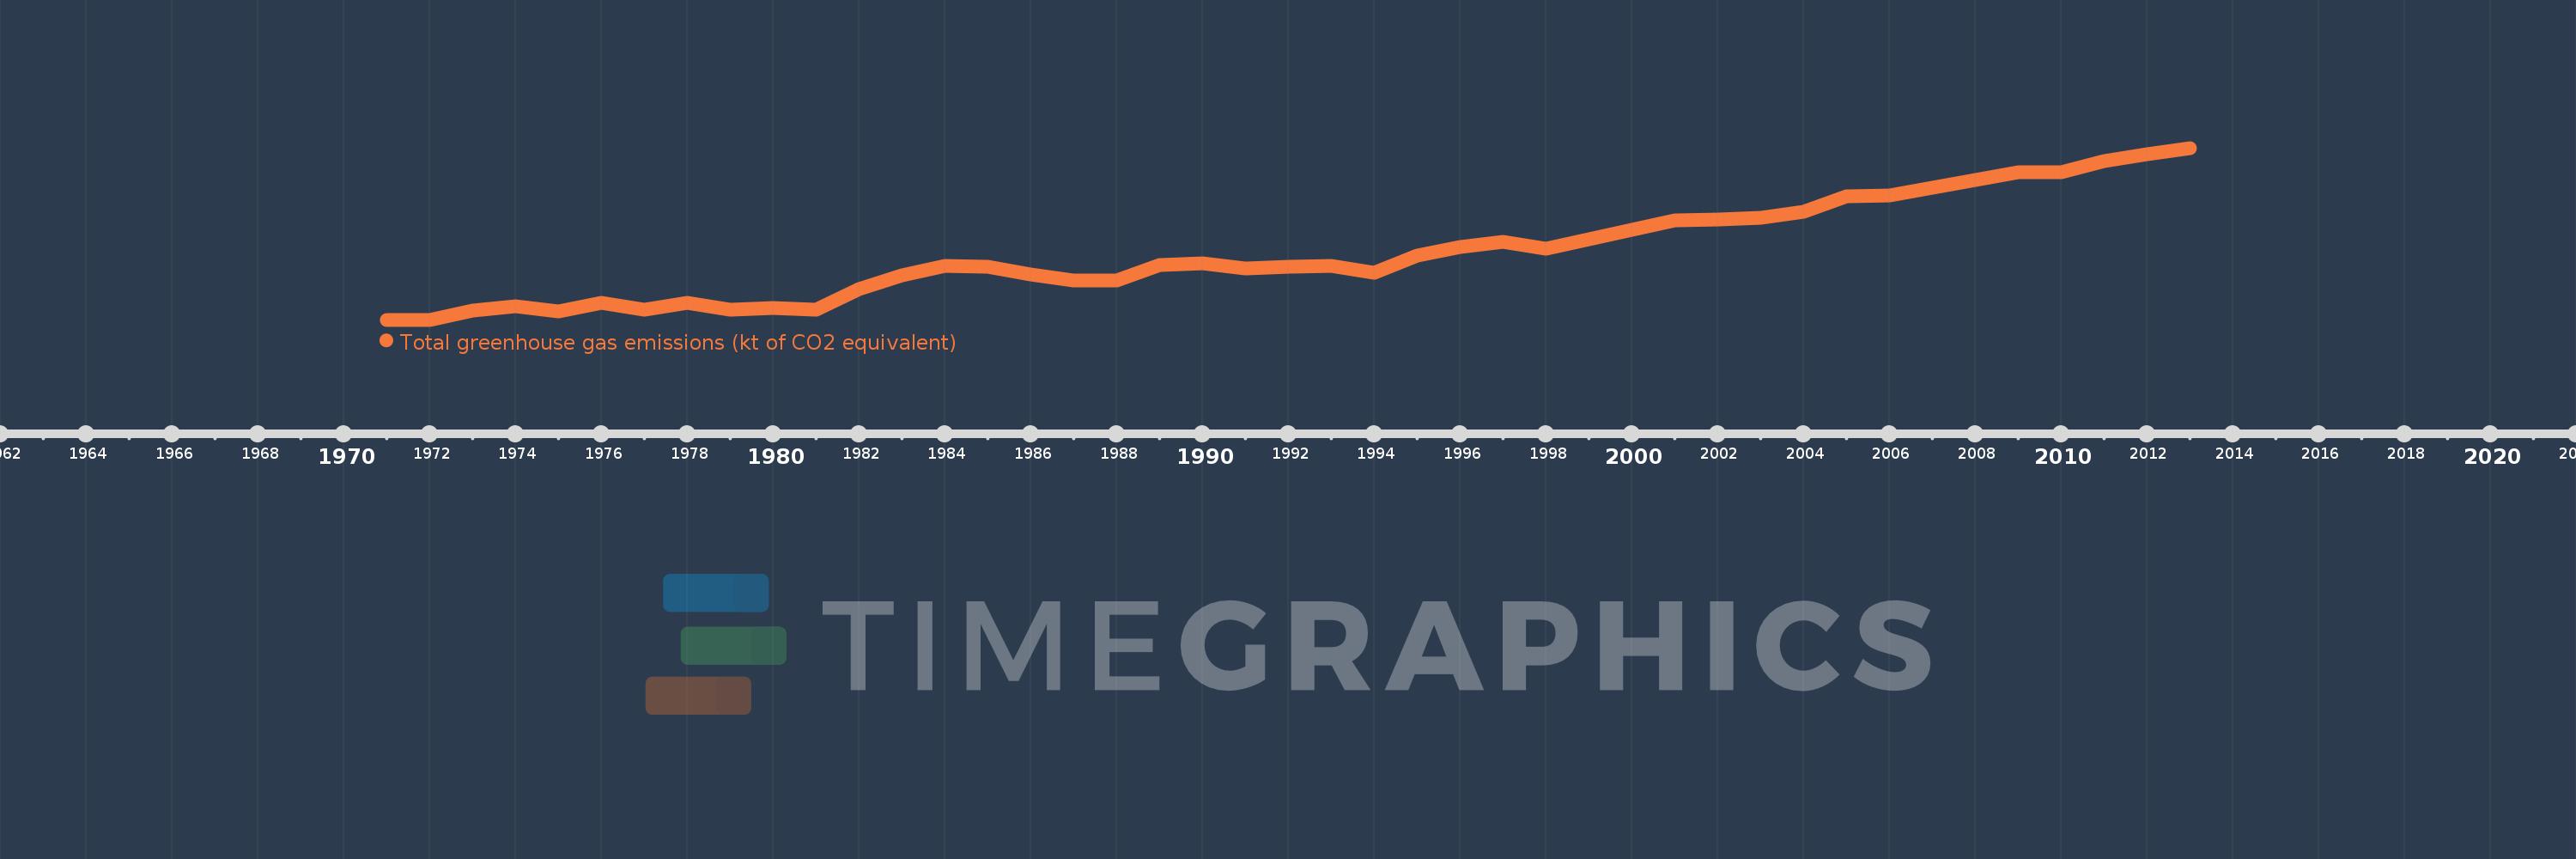
Total greenhouse gas emissions (kt of CO2 equivalent)
2013,2012,2011,2010,2009,2008,2007,2006,2005,2004,2003,2002,2001,1998,1997,1996,1995,1994,1993,1992,1991,1990,1989,1988,1987,1986,1985,1984,1983,1982,1981,1980,1979,1978,1977,1976,1975,1974,1973,1972,1971
This statistics in other country:
AfghanistanAlbaniaAlgeriaAmerican SamoaAngolaAntigua and BarbudaArab WorldArgentinaArmeniaArubaAustraliaAustriaAzerbaijanBahamas, TheBahrainBangladeshBarbadosBelarusBelgiumBelizeBeninBermudaBhutanBoliviaBosnia and HerzegovinaBotswanaBrazilBritish Virgin IslandsBrunei DarussalamBulgariaBurkina FasoBurundiCabo VerdeCambodiaCameroonCanadaCaribbean small statesCayman IslandsCentral African RepublicCentral Europe and the BalticsChadChileChinaColombiaComorosCongo, Dem. Rep.Congo, Rep.Costa RicaCote d'IvoireCroatiaCubaCyprusCzech RepublicDenmarkDjiboutiDominicaDominican RepublicEarly-demographic dividendEast Asia & PacificEast Asia & Pacific (excluding high income)East Asia & Pacific (IDA & IBRD countries)EcuadorEgypt, Arab Rep.El SalvadorEquatorial GuineaEritreaEstoniaEthiopiaEuro areaEurope & Central AsiaEurope & Central Asia (excluding high income)Europe & Central Asia (IDA & IBRD countries)European UnionFijiFinlandFragile and conflict affected situationsFranceFrench PolynesiaGabonGambia, TheGeorgiaGermanyGhanaGibraltarGreeceGrenadaGuamGuatemalaGuineaGuinea-BissauGuyanaHaitiHeavily indebted poor countries (HIPC)High incomeHondurasHong Kong SAR, ChinaHungaryIBRD onlyIcelandIDA & IBRD totalIDA blendIDA onlyIDA totalIndiaIndonesiaIran, Islamic Rep.IraqIrelandIsraelItalyJamaicaJapanJordanKazakhstanKenyaKiribatiKorea, Dem. People’s Rep.Korea, Rep.KuwaitKyrgyz RepublicLao PDRLate-demographic dividendLatin America & Caribbean Latin America & Caribbean (excluding high income)Latin America & the Caribbean (IDA & IBRD countries)LatviaLeast developed countries: UN classificationLebanonLesothoLiberiaLibyaLithuaniaLow & middle incomeLow incomeLower middle incomeLuxembourgMacao SAR, ChinaMacedonia, FYRMadagascarMalawiMalaysiaMaldivesMaliMaltaMarshall IslandsMauritaniaMauritiusMexicoMicronesia, Fed. Sts.Middle East & North AfricaMiddle East & North Africa (excluding high income)Middle East & North Africa (IDA & IBRD countries)Middle incomeMoldovaMongoliaMoroccoMozambiqueMyanmarNamibiaNepalNetherlandsNew CaledoniaNew ZealandNicaraguaNigerNigeriaNorth AmericaNorthern Mariana IslandsNorwayOECD membersOmanOther small statesPacific island small statesPakistanPanamaPapua New GuineaParaguayPeruPhilippinesPolandPortugalPost-demographic dividendPre-demographic dividendPuerto RicoQatarRomaniaRussian FederationRwandaSamoaSao Tome and PrincipeSaudi ArabiaSenegalSeychellesSierra LeoneSingaporeSlovak RepublicSloveniaSmall statesSolomon IslandsSomaliaSouth AfricaSouth AsiaSouth Asia (IDA & IBRD)SpainSri LankaSt. Kitts and NevisSt. LuciaSt. Vincent and the GrenadinesSub-Saharan Africa Sub-Saharan Africa (excluding high income)Sub-Saharan Africa (IDA & IBRD countries)SudanSurinameSwazilandSwedenSwitzerlandSyrian Arab RepublicTajikistanTanzaniaThailandTimor-LesteTogoTongaTrinidad and TobagoTunisiaTurkeyTurkmenistanTurks and Caicos IslandsTuvaluUgandaUkraineUnited Arab EmiratesUnited KingdomUnited StatesUpper middle incomeUruguayUzbekistanVanuatuVenezuela, RBVietnamVirgin Islands (U.S.)WorldYemen, Rep.ZambiaZimbabwe Timeline:
This timeline shows a graph from 1971 to 2013 of St. Lucia. No data until 1970. Number of actual observations by date: 41.
Source name:
World Development Indicators
Source organization:
European Commission, Joint Research Centre (JRC)/Netherlands Environmental Assessment Agency (PBL). Emission Database for Global Atmospheric Research (EDGAR), EDGARv4.2 FT2012: http://edgar.jrc.ec.europa.eu/
Categories, topics:
Climate Change, Environment
Last updated:
apr 23, 2017
Indicators value changes by year
Minimum:
140.295
jan 1, 1971
Maximum:
598.766
jan 1, 2013
At the date of observation
Value
Absolute change
Change from previous value
jan 1, 1971
140.295
+140.295
0.0%
jan 1, 1972
140.351
+0.056
0.04%
jan 1, 1973
165.772
+25.42
18.11%
jan 1, 1974
175.498
+9.726
5.87%
jan 1, 1975
162.046
-13.452
-7.66%
jan 1, 1976
184.556
+22.51
13.89%
jan 1, 1977
166.116
-18.44
-9.99%
jan 1, 1978
184.94
+18.824
11.33%
jan 1, 1979
167.381
-17.559
-9.49%
jan 1, 1980
170.778
+3.397
2.03%
jan 1, 1981
167.928
-2.85
-1.67%
jan 1, 1982
222.707
+54.779
32.62%
jan 1, 1983
258.234
+35.527
15.95%
jan 1, 1984
284.063
+25.83
10.0%
jan 1, 1985
281.585
-2.479
-0.87%
jan 1, 1986
260.468
-21.116
-7.5%
jan 1, 1987
244.387
-16.082
-6.17%
jan 1, 1988
245.372
+0.986
0.4%
jan 1, 1989
286.778
+41.406
16.87%
jan 1, 1990
291.51
+4.732
1.65%
jan 1, 1991
278.117
-13.393
-4.59%
jan 1, 1992
282.065
+3.948
1.42%
jan 1, 1993
284.798
+2.733
0.97%
jan 1, 1994
264.855
-19.943
-7.0%
jan 1, 1995
312.077
+47.222
17.83%
jan 1, 1996
334.146
+22.069
7.07%
jan 1, 1997
347.697
+13.552
4.06%
jan 1, 1998
330.528
-17.169
-4.94%
jan 1, 2001
404.935
+74.407
22.51%
jan 1, 2002
408.26
+3.325
0.82%
jan 1, 2003
412.314
+4.054
0.99%
jan 1, 2004
427.334
+15.02
3.64%
jan 1, 2005
470.332
+42.997
10.06%
jan 1, 2006
473.066
+2.735
0.58%
jan 1, 2007
493.087
+20.021
4.23%
jan 1, 2008
512.253
+19.166
3.89%
jan 1, 2009
533.672
+21.419
4.18%
jan 1, 2010
534.356
+0.683
0.13%
jan 1, 2011
563.916
+29.56
5.53%
jan 1, 2012
582.336
+18.42
3.27%
jan 1, 2013
598.766
+16.43
2.82%
Ranking of countries by current statistics by years


Comments: