29
/
en
AIzaSyAYiBZKx7MnpbEhh9jyipgxe19OcubqV5w
April 1, 2024
120548
Djibouti
DJI
true
2
1
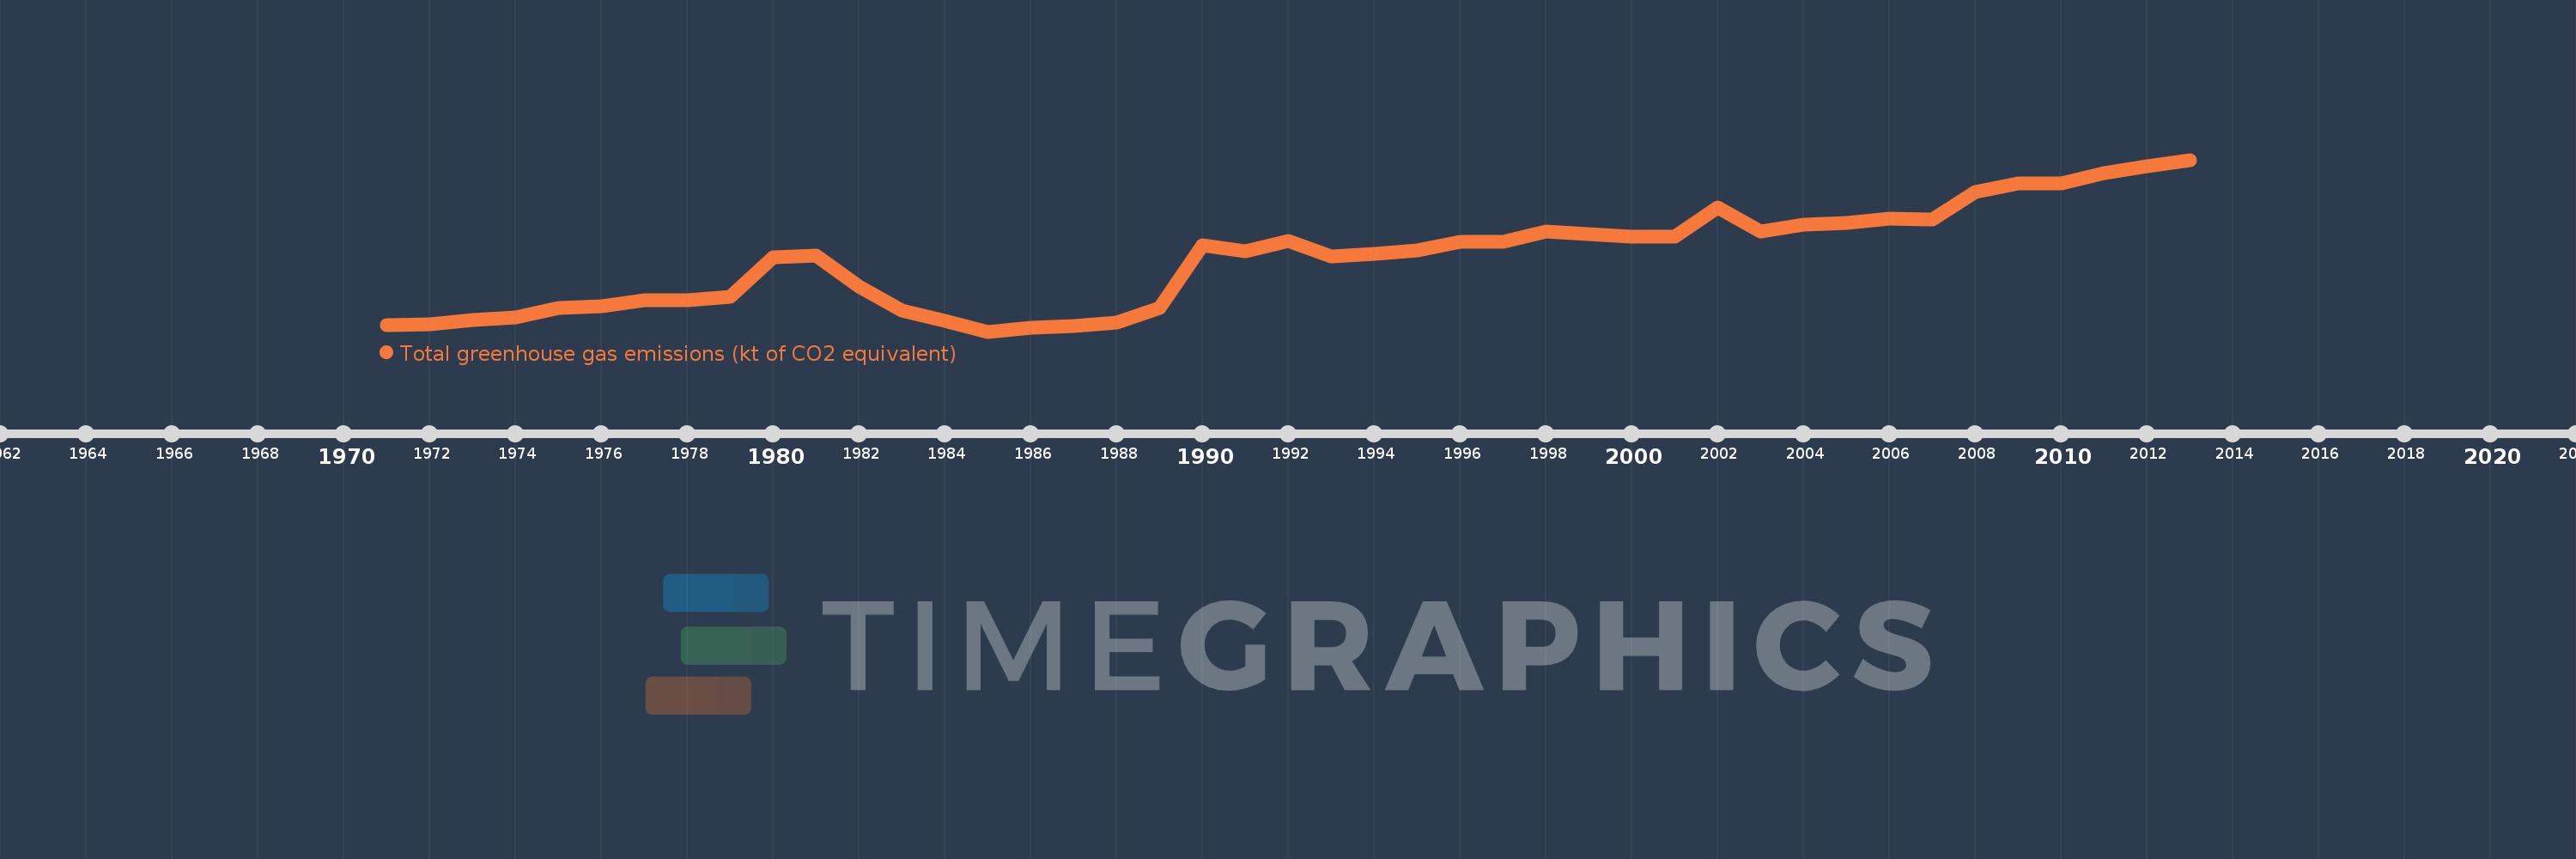
Total greenhouse gas emissions (kt of CO2 equivalent)
2013,2012,2011,2010,2009,2008,2007,2006,2005,2004,2003,2002,2001,2000,1999,1998,1997,1996,1995,1994,1993,1992,1991,1990,1989,1988,1987,1986,1985,1984,1983,1982,1981,1980,1979,1978,1977,1976,1975,1974,1973,1972,1971
This statistics in other country:
AfghanistanAlbaniaAlgeriaAmerican SamoaAngolaAntigua and BarbudaArab WorldArgentinaArmeniaArubaAustraliaAustriaAzerbaijanBahamas, TheBahrainBangladeshBarbadosBelarusBelgiumBelizeBeninBermudaBhutanBoliviaBosnia and HerzegovinaBotswanaBrazilBritish Virgin IslandsBrunei DarussalamBulgariaBurkina FasoBurundiCabo VerdeCambodiaCameroonCanadaCaribbean small statesCayman IslandsCentral African RepublicCentral Europe and the BalticsChadChileChinaColombiaComorosCongo, Dem. Rep.Congo, Rep.Costa RicaCote d'IvoireCroatiaCubaCyprusCzech RepublicDenmarkDjiboutiDominicaDominican RepublicEarly-demographic dividendEast Asia & PacificEast Asia & Pacific (excluding high income)East Asia & Pacific (IDA & IBRD countries)EcuadorEgypt, Arab Rep.El SalvadorEquatorial GuineaEritreaEstoniaEthiopiaEuro areaEurope & Central AsiaEurope & Central Asia (excluding high income)Europe & Central Asia (IDA & IBRD countries)European UnionFijiFinlandFragile and conflict affected situationsFranceFrench PolynesiaGabonGambia, TheGeorgiaGermanyGhanaGibraltarGreeceGrenadaGuamGuatemalaGuineaGuinea-BissauGuyanaHaitiHeavily indebted poor countries (HIPC)High incomeHondurasHong Kong SAR, ChinaHungaryIBRD onlyIcelandIDA & IBRD totalIDA blendIDA onlyIDA totalIndiaIndonesiaIran, Islamic Rep.IraqIrelandIsraelItalyJamaicaJapanJordanKazakhstanKenyaKiribatiKorea, Dem. People’s Rep.Korea, Rep.KuwaitKyrgyz RepublicLao PDRLate-demographic dividendLatin America & Caribbean Latin America & Caribbean (excluding high income)Latin America & the Caribbean (IDA & IBRD countries)LatviaLeast developed countries: UN classificationLebanonLesothoLiberiaLibyaLithuaniaLow & middle incomeLow incomeLower middle incomeLuxembourgMacao SAR, ChinaMacedonia, FYRMadagascarMalawiMalaysiaMaldivesMaliMaltaMarshall IslandsMauritaniaMauritiusMexicoMicronesia, Fed. Sts.Middle East & North AfricaMiddle East & North Africa (excluding high income)Middle East & North Africa (IDA & IBRD countries)Middle incomeMoldovaMongoliaMoroccoMozambiqueMyanmarNamibiaNepalNetherlandsNew CaledoniaNew ZealandNicaraguaNigerNigeriaNorth AmericaNorthern Mariana IslandsNorwayOECD membersOmanOther small statesPacific island small statesPakistanPanamaPapua New GuineaParaguayPeruPhilippinesPolandPortugalPost-demographic dividendPre-demographic dividendPuerto RicoQatarRomaniaRussian FederationRwandaSamoaSao Tome and PrincipeSaudi ArabiaSenegalSeychellesSierra LeoneSingaporeSlovak RepublicSloveniaSmall statesSolomon IslandsSomaliaSouth AfricaSouth AsiaSouth Asia (IDA & IBRD)SpainSri LankaSt. Kitts and NevisSt. LuciaSt. Vincent and the GrenadinesSub-Saharan Africa Sub-Saharan Africa (excluding high income)Sub-Saharan Africa (IDA & IBRD countries)SudanSurinameSwazilandSwedenSwitzerlandSyrian Arab RepublicTajikistanTanzaniaThailandTimor-LesteTogoTongaTrinidad and TobagoTunisiaTurkeyTurkmenistanTurks and Caicos IslandsTuvaluUgandaUkraineUnited Arab EmiratesUnited KingdomUnited StatesUpper middle incomeUruguayUzbekistanVanuatuVenezuela, RBVietnamVirgin Islands (U.S.)WorldYemen, Rep.ZambiaZimbabwe Timeline:
This timeline shows a graph from 1971 to 2013 of Djibouti. No data until 1970. Number of actual observations by date: 43.
Source name:
World Development Indicators
Source organization:
European Commission, Joint Research Centre (JRC)/Netherlands Environmental Assessment Agency (PBL). Emission Database for Global Atmospheric Research (EDGAR), EDGARv4.2 FT2012: http://edgar.jrc.ec.europa.eu/
Categories, topics:
Climate Change, Environment
Last updated:
apr 23, 2017
Indicators value changes by year
Minimum:
985.199
jan 1, 1985
Maximum:
2.766K
jan 1, 2013
At the date of observation
Value
Absolute change
Change from previous value
jan 1, 1971
1.048K
+1.048K
0.0%
jan 1, 1972
1.059K
+11.05
1.05%
jan 1, 1973
1.102K
+42.718
4.03%
jan 1, 1974
1.13K
+27.72
2.52%
jan 1, 1975
1.226K
+95.909
8.49%
jan 1, 1976
1.251K
+25.262
2.06%
jan 1, 1977
1.31K
+58.674
4.69%
jan 1, 1978
1.313K
+3.211
0.25%
jan 1, 1979
1.35K
+37.055
2.82%
jan 1, 1980
1.758K
+407.573
30.19%
jan 1, 1981
1.772K
+14.559
0.83%
jan 1, 1982
1.455K
-316.942
-17.88%
jan 1, 1983
1.205K
-250.039
-17.18%
jan 1, 1984
1.092K
-112.895
-9.37%
jan 1, 1985
985.199
-107.052
-9.8%
jan 1, 1986
1.029K
+43.391
4.4%
jan 1, 1987
1.043K
+14.36
1.4%
jan 1, 1988
1.077K
+33.687
3.23%
jan 1, 1989
1.234K
+157.306
14.61%
jan 1, 1990
1.878K
+644.521
52.23%
jan 1, 1991
1.822K
-56.871
-3.03%
jan 1, 1992
1.92K
+98.71
5.42%
jan 1, 1993
1.767K
-153.224
-7.98%
jan 1, 1994
1.79K
+23.074
1.31%
jan 1, 1995
1.825K
+34.886
1.95%
jan 1, 1996
1.914K
+89.384
4.9%
jan 1, 1997
1.916K
+1.42
0.07%
jan 1, 1998
2.018K
+102.407
5.35%
jan 1, 1999
1.995K
-23.665
-1.17%
jan 1, 2000
1.972K
-22.651
-1.14%
jan 1, 2001
1.969K
-2.766
-0.14%
jan 1, 2002
2.274K
+304.735
15.48%
jan 1, 2003
2.019K
-254.895
-11.21%
jan 1, 2004
2.095K
+75.815
3.76%
jan 1, 2005
2.116K
+21.073
1.01%
jan 1, 2006
2.16K
+44.14
2.09%
jan 1, 2007
2.15K
-10.211
-0.47%
jan 1, 2008
2.432K
+282.605
13.15%
jan 1, 2009
2.519K
+86.136
3.54%
jan 1, 2010
2.523K
+4.648
0.18%
jan 1, 2011
2.63K
+106.617
4.23%
jan 1, 2012
2.702K
+71.79
2.73%
jan 1, 2013
2.766K
+64.681
2.39%
Ranking of countries by current statistics by years


Comments: