29
/
en
AIzaSyAYiBZKx7MnpbEhh9jyipgxe19OcubqV5w
April 1, 2024
213953
Northern Mariana Islands
MNP
true
2
1
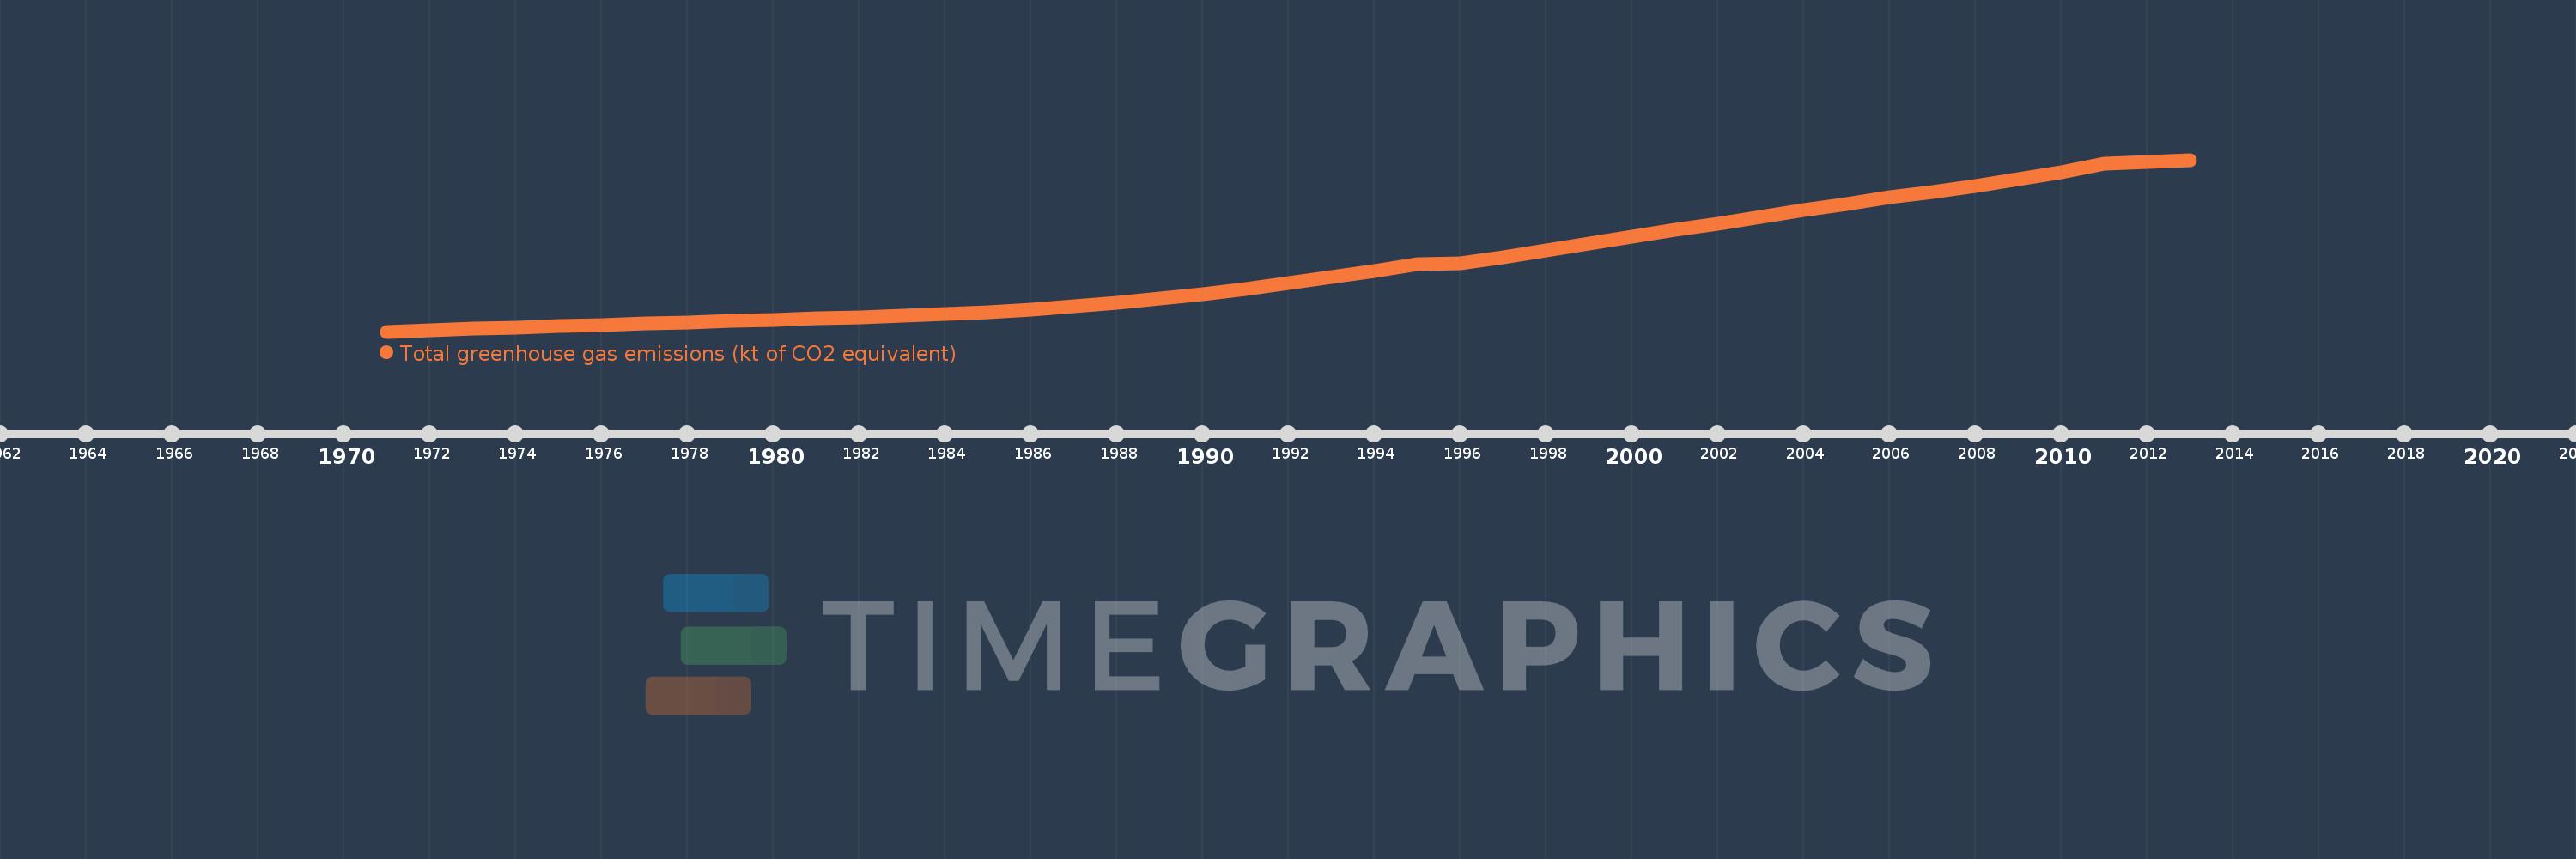
Total greenhouse gas emissions (kt of CO2 equivalent)
2013,2012,2011,2010,2009,2008,2007,2006,2005,2004,2003,2002,2001,2000,1999,1998,1997,1996,1995,1994,1993,1992,1991,1990,1989,1988,1987,1986,1985,1984,1983,1982,1981,1980,1979,1978,1977,1976,1975,1974,1973,1972,1971
This statistics in other country:
AfghanistanAlbaniaAlgeriaAmerican SamoaAngolaAntigua and BarbudaArab WorldArgentinaArmeniaArubaAustraliaAustriaAzerbaijanBahamas, TheBahrainBangladeshBarbadosBelarusBelgiumBelizeBeninBermudaBhutanBoliviaBosnia and HerzegovinaBotswanaBrazilBritish Virgin IslandsBrunei DarussalamBulgariaBurkina FasoBurundiCabo VerdeCambodiaCameroonCanadaCaribbean small statesCayman IslandsCentral African RepublicCentral Europe and the BalticsChadChileChinaColombiaComorosCongo, Dem. Rep.Congo, Rep.Costa RicaCote d'IvoireCroatiaCubaCyprusCzech RepublicDenmarkDjiboutiDominicaDominican RepublicEarly-demographic dividendEast Asia & PacificEast Asia & Pacific (excluding high income)East Asia & Pacific (IDA & IBRD countries)EcuadorEgypt, Arab Rep.El SalvadorEquatorial GuineaEritreaEstoniaEthiopiaEuro areaEurope & Central AsiaEurope & Central Asia (excluding high income)Europe & Central Asia (IDA & IBRD countries)European UnionFijiFinlandFragile and conflict affected situationsFranceFrench PolynesiaGabonGambia, TheGeorgiaGermanyGhanaGibraltarGreeceGrenadaGuamGuatemalaGuineaGuinea-BissauGuyanaHaitiHeavily indebted poor countries (HIPC)High incomeHondurasHong Kong SAR, ChinaHungaryIBRD onlyIcelandIDA & IBRD totalIDA blendIDA onlyIDA totalIndiaIndonesiaIran, Islamic Rep.IraqIrelandIsraelItalyJamaicaJapanJordanKazakhstanKenyaKiribatiKorea, Dem. People’s Rep.Korea, Rep.KuwaitKyrgyz RepublicLao PDRLate-demographic dividendLatin America & Caribbean Latin America & Caribbean (excluding high income)Latin America & the Caribbean (IDA & IBRD countries)LatviaLeast developed countries: UN classificationLebanonLesothoLiberiaLibyaLithuaniaLow & middle incomeLow incomeLower middle incomeLuxembourgMacao SAR, ChinaMacedonia, FYRMadagascarMalawiMalaysiaMaldivesMaliMaltaMarshall IslandsMauritaniaMauritiusMexicoMicronesia, Fed. Sts.Middle East & North AfricaMiddle East & North Africa (excluding high income)Middle East & North Africa (IDA & IBRD countries)Middle incomeMoldovaMongoliaMoroccoMozambiqueMyanmarNamibiaNepalNetherlandsNew CaledoniaNew ZealandNicaraguaNigerNigeriaNorth AmericaNorthern Mariana IslandsNorwayOECD membersOmanOther small statesPacific island small statesPakistanPanamaPapua New GuineaParaguayPeruPhilippinesPolandPortugalPost-demographic dividendPre-demographic dividendPuerto RicoQatarRomaniaRussian FederationRwandaSamoaSao Tome and PrincipeSaudi ArabiaSenegalSeychellesSierra LeoneSingaporeSlovak RepublicSloveniaSmall statesSolomon IslandsSomaliaSouth AfricaSouth AsiaSouth Asia (IDA & IBRD)SpainSri LankaSt. Kitts and NevisSt. LuciaSt. Vincent and the GrenadinesSub-Saharan Africa Sub-Saharan Africa (excluding high income)Sub-Saharan Africa (IDA & IBRD countries)SudanSurinameSwazilandSwedenSwitzerlandSyrian Arab RepublicTajikistanTanzaniaThailandTimor-LesteTogoTongaTrinidad and TobagoTunisiaTurkeyTurkmenistanTurks and Caicos IslandsTuvaluUgandaUkraineUnited Arab EmiratesUnited KingdomUnited StatesUpper middle incomeUruguayUzbekistanVanuatuVenezuela, RBVietnamVirgin Islands (U.S.)WorldYemen, Rep.ZambiaZimbabwe Timeline:
This timeline shows a graph from 1971 to 2013 of Northern Mariana Islands. No data until 1970. Number of actual observations by date: 43.
Source name:
World Development Indicators
Source organization:
European Commission, Joint Research Centre (JRC)/Netherlands Environmental Assessment Agency (PBL). Emission Database for Global Atmospheric Research (EDGAR), EDGARv4.2 FT2012: http://edgar.jrc.ec.europa.eu/
Categories, topics:
Climate Change, Environment
Last updated:
apr 23, 2017
Indicators value changes by year
Maximum:
12.489
jan 1, 2013
At the date of observation
Value
Absolute change
Change from previous value
jan 1, 1971
2.662
+2.662
0.0%
jan 1, 1972
2.743
+0.081
3.03%
jan 1, 1973
2.824
+0.081
2.95%
jan 1, 1974
2.895
+0.071
2.51%
jan 1, 1975
2.968
+0.073
2.52%
jan 1, 1976
3.041
+0.074
2.49%
jan 1, 1977
3.117
+0.075
2.48%
jan 1, 1978
3.188
+0.072
2.3%
jan 1, 1979
3.257
+0.068
2.15%
jan 1, 1980
3.323
+0.066
2.03%
jan 1, 1981
3.402
+0.079
2.36%
jan 1, 1982
3.489
+0.087
2.57%
jan 1, 1983
3.582
+0.093
2.67%
jan 1, 1984
3.666
+0.084
2.34%
jan 1, 1985
3.783
+0.118
3.21%
jan 1, 1986
3.924
+0.141
3.72%
jan 1, 1987
4.101
+0.176
4.49%
jan 1, 1988
4.31
+0.209
5.1%
jan 1, 1989
4.551
+0.242
5.61%
jan 1, 1990
4.821
+0.27
5.93%
jan 1, 1991
5.116
+0.295
6.11%
jan 1, 1992
5.453
+0.337
6.59%
jan 1, 1993
5.796
+0.342
6.28%
jan 1, 1994
6.143
+0.347
5.99%
jan 1, 1995
6.495
+0.353
5.74%
jan 1, 1996
6.556
+0.06
0.93%
jan 1, 1997
6.933
+0.377
5.75%
jan 1, 1998
7.32
+0.387
5.58%
jan 1, 1999
7.704
+0.385
5.26%
jan 1, 2000
8.089
+0.385
4.99%
jan 1, 2001
8.466
+0.376
4.65%
jan 1, 2002
8.847
+0.381
4.51%
jan 1, 2003
9.223
+0.376
4.25%
jan 1, 2004
9.592
+0.37
4.01%
jan 1, 2005
9.963
+0.371
3.86%
jan 1, 2006
10.332
+0.369
3.7%
jan 1, 2007
10.651
+0.319
3.09%
jan 1, 2008
11.0
+0.35
3.28%
jan 1, 2009
11.384
+0.384
3.49%
jan 1, 2010
11.796
+0.412
3.62%
jan 1, 2011
12.244
+0.448
3.8%
jan 1, 2012
12.366
+0.122
1.0%
jan 1, 2013
12.489
+0.122
0.99%
Ranking of countries by current statistics by years


Comments: