29
/
en
AIzaSyAYiBZKx7MnpbEhh9jyipgxe19OcubqV5w
April 1, 2024
208528
Netherlands
NLD
true
2
1
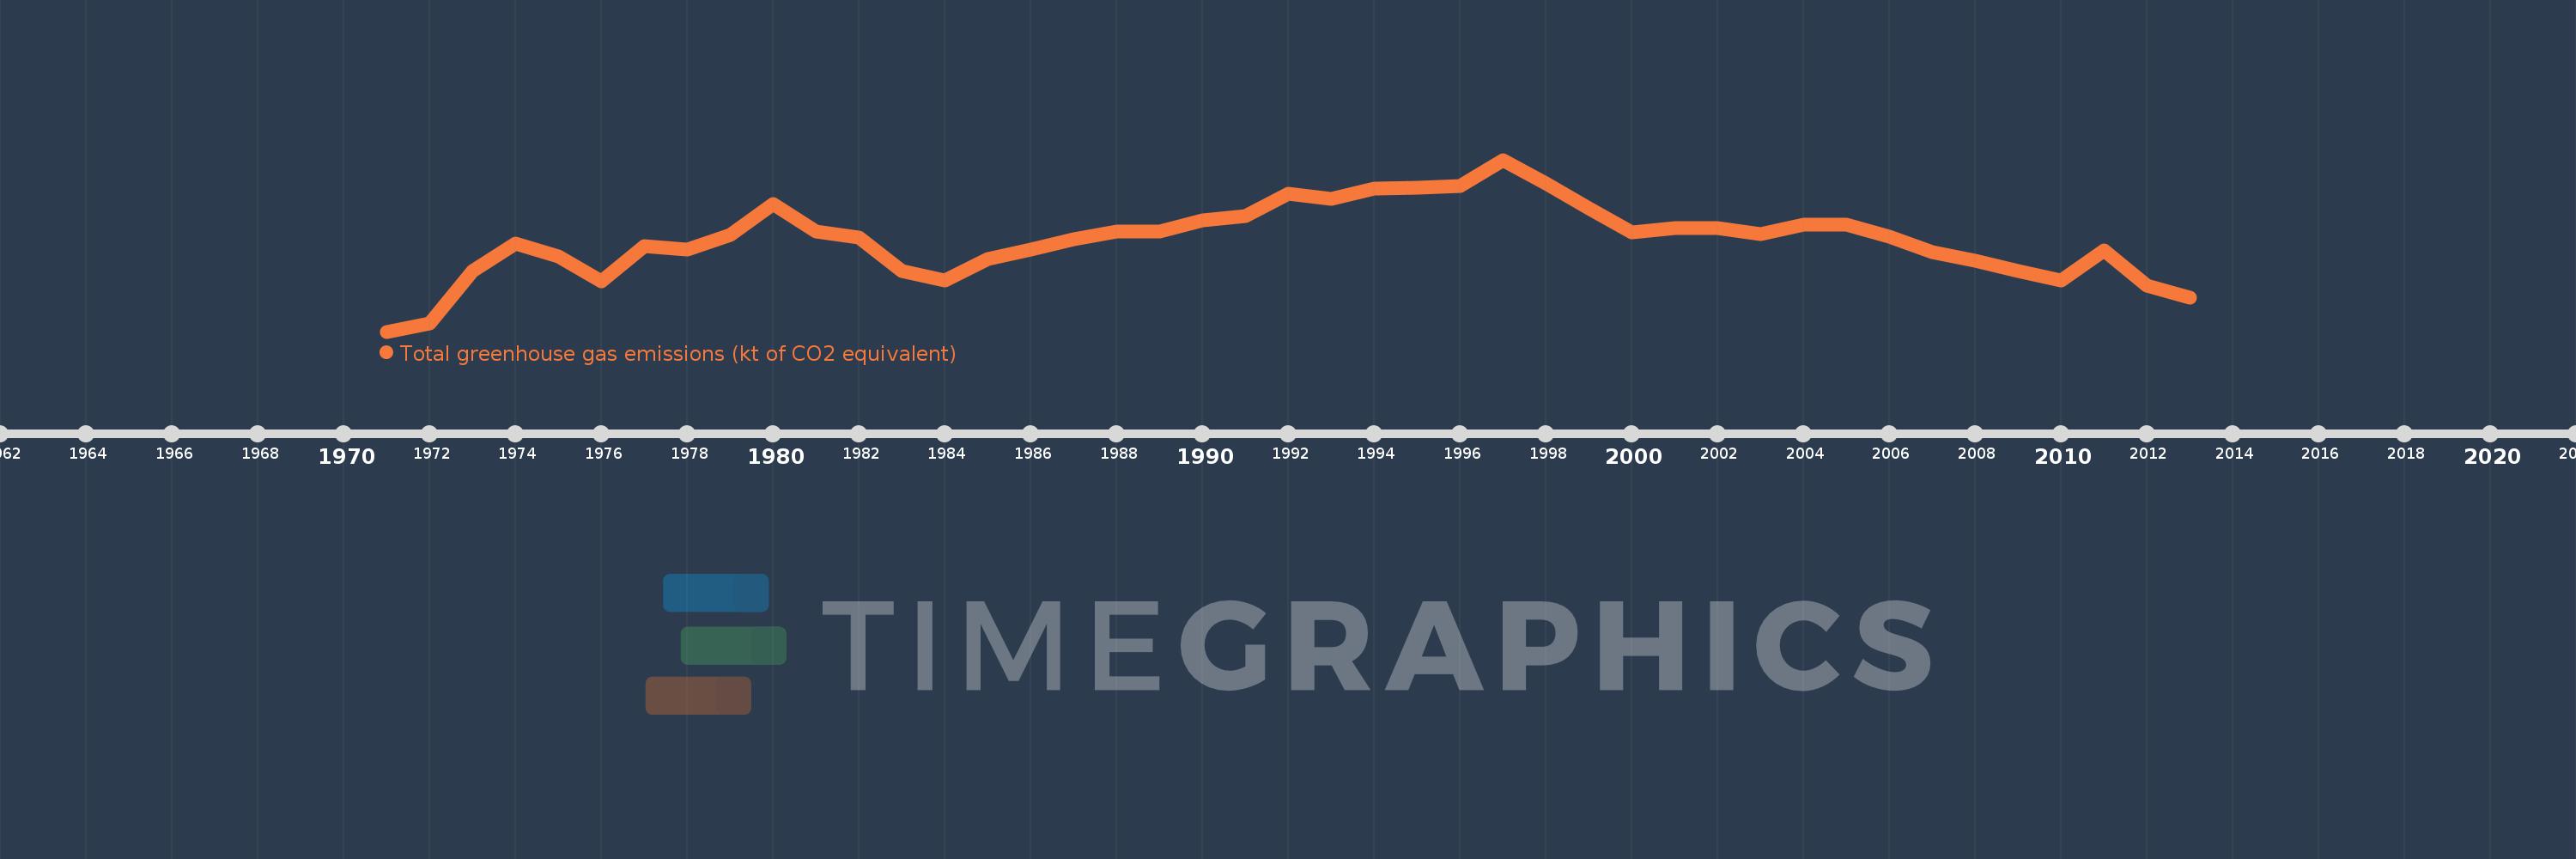
Total greenhouse gas emissions (kt of CO2 equivalent)
2013,2012,2011,2010,2009,2008,2007,2006,2005,2004,2003,2002,2001,2000,1999,1998,1997,1996,1995,1994,1993,1992,1991,1990,1989,1988,1987,1986,1985,1984,1983,1982,1981,1980,1979,1978,1977,1976,1975,1974,1973,1972,1971
This statistics in other country:
AfghanistanAlbaniaAlgeriaAmerican SamoaAngolaAntigua and BarbudaArab WorldArgentinaArmeniaArubaAustraliaAustriaAzerbaijanBahamas, TheBahrainBangladeshBarbadosBelarusBelgiumBelizeBeninBermudaBhutanBoliviaBosnia and HerzegovinaBotswanaBrazilBritish Virgin IslandsBrunei DarussalamBulgariaBurkina FasoBurundiCabo VerdeCambodiaCameroonCanadaCaribbean small statesCayman IslandsCentral African RepublicCentral Europe and the BalticsChadChileChinaColombiaComorosCongo, Dem. Rep.Congo, Rep.Costa RicaCote d'IvoireCroatiaCubaCyprusCzech RepublicDenmarkDjiboutiDominicaDominican RepublicEarly-demographic dividendEast Asia & PacificEast Asia & Pacific (excluding high income)East Asia & Pacific (IDA & IBRD countries)EcuadorEgypt, Arab Rep.El SalvadorEquatorial GuineaEritreaEstoniaEthiopiaEuro areaEurope & Central AsiaEurope & Central Asia (excluding high income)Europe & Central Asia (IDA & IBRD countries)European UnionFijiFinlandFragile and conflict affected situationsFranceFrench PolynesiaGabonGambia, TheGeorgiaGermanyGhanaGibraltarGreeceGrenadaGuamGuatemalaGuineaGuinea-BissauGuyanaHaitiHeavily indebted poor countries (HIPC)High incomeHondurasHong Kong SAR, ChinaHungaryIBRD onlyIcelandIDA & IBRD totalIDA blendIDA onlyIDA totalIndiaIndonesiaIran, Islamic Rep.IraqIrelandIsraelItalyJamaicaJapanJordanKazakhstanKenyaKiribatiKorea, Dem. People’s Rep.Korea, Rep.KuwaitKyrgyz RepublicLao PDRLate-demographic dividendLatin America & Caribbean Latin America & Caribbean (excluding high income)Latin America & the Caribbean (IDA & IBRD countries)LatviaLeast developed countries: UN classificationLebanonLesothoLiberiaLibyaLithuaniaLow & middle incomeLow incomeLower middle incomeLuxembourgMacao SAR, ChinaMacedonia, FYRMadagascarMalawiMalaysiaMaldivesMaliMaltaMarshall IslandsMauritaniaMauritiusMexicoMicronesia, Fed. Sts.Middle East & North AfricaMiddle East & North Africa (excluding high income)Middle East & North Africa (IDA & IBRD countries)Middle incomeMoldovaMongoliaMoroccoMozambiqueMyanmarNamibiaNepalNetherlandsNew CaledoniaNew ZealandNicaraguaNigerNigeriaNorth AmericaNorthern Mariana IslandsNorwayOECD membersOmanOther small statesPacific island small statesPakistanPanamaPapua New GuineaParaguayPeruPhilippinesPolandPortugalPost-demographic dividendPre-demographic dividendPuerto RicoQatarRomaniaRussian FederationRwandaSamoaSao Tome and PrincipeSaudi ArabiaSenegalSeychellesSierra LeoneSingaporeSlovak RepublicSloveniaSmall statesSolomon IslandsSomaliaSouth AfricaSouth AsiaSouth Asia (IDA & IBRD)SpainSri LankaSt. Kitts and NevisSt. LuciaSt. Vincent and the GrenadinesSub-Saharan Africa Sub-Saharan Africa (excluding high income)Sub-Saharan Africa (IDA & IBRD countries)SudanSurinameSwazilandSwedenSwitzerlandSyrian Arab RepublicTajikistanTanzaniaThailandTimor-LesteTogoTongaTrinidad and TobagoTunisiaTurkeyTurkmenistanTurks and Caicos IslandsTuvaluUgandaUkraineUnited Arab EmiratesUnited KingdomUnited StatesUpper middle incomeUruguayUzbekistanVanuatuVenezuela, RBVietnamVirgin Islands (U.S.)WorldYemen, Rep.ZambiaZimbabwe Timeline:
This timeline shows a graph from 1971 to 2013 of Netherlands. No data until 1970. Number of actual observations by date: 43.
Source name:
World Development Indicators
Source organization:
European Commission, Joint Research Centre (JRC)/Netherlands Environmental Assessment Agency (PBL). Emission Database for Global Atmospheric Research (EDGAR), EDGARv4.2 FT2012: http://edgar.jrc.ec.europa.eu/
Categories, topics:
Climate Change, Environment
Last updated:
apr 23, 2017
Indicators value changes by year
Minimum:
183.917K
jan 1, 1971
Maximum:
244.204K
jan 1, 1997
At the date of observation
Value
Absolute change
Change from previous value
jan 1, 1971
183.917K
+183.917K
0.0%
jan 1, 1972
186.709K
+2.792K
1.52%
jan 1, 1973
205.138K
+18.429K
9.87%
jan 1, 1974
214.755K
+9.617K
4.69%
jan 1, 1975
210.406K
-4.349K
-2.02%
jan 1, 1976
201.646K
-8.76K
-4.16%
jan 1, 1977
213.891K
+12.245K
6.07%
jan 1, 1978
212.635K
-1.257K
-0.59%
jan 1, 1979
217.685K
+5.05K
2.37%
jan 1, 1980
228.827K
+11.143K
5.12%
jan 1, 1981
219.031K
-9.796K
-4.28%
jan 1, 1982
216.959K
-2.072K
-0.95%
jan 1, 1983
205.036K
-11.923K
-5.5%
jan 1, 1984
201.897K
-3.14K
-1.53%
jan 1, 1985
209.48K
+7.583K
3.76%
jan 1, 1986
212.565K
+3.085K
1.47%
jan 1, 1987
216.328K
+3.763K
1.77%
jan 1, 1988
219.079K
+2.751K
1.27%
jan 1, 1989
219.095K
+16.558
0.01%
jan 1, 1990
223.05K
+3.955K
1.81%
jan 1, 1991
224.468K
+1.418K
0.64%
jan 1, 1992
232.342K
+7.874K
3.51%
jan 1, 1993
230.579K
-1.762K
-0.76%
jan 1, 1994
234.205K
+3.625K
1.57%
jan 1, 1995
234.258K
+53.23
0.02%
jan 1, 1996
235.053K
+795.01
0.34%
jan 1, 1997
244.204K
+9.151K
3.89%
jan 1, 1998
235.836K
-8.368K
-3.43%
jan 1, 1999
227.061K
-8.775K
-3.72%
jan 1, 2000
218.723K
-8.339K
-3.67%
jan 1, 2001
220.32K
+1.597K
0.73%
jan 1, 2002
220.253K
-67.382
-0.03%
jan 1, 2003
218.276K
-1.976K
-0.9%
jan 1, 2004
221.354K
+3.078K
1.41%
jan 1, 2005
221.355K
+0.885
0.0%
jan 1, 2006
217.084K
-4.272K
-1.93%
jan 1, 2007
211.768K
-5.316K
-2.45%
jan 1, 2008
208.848K
-2.92K
-1.38%
jan 1, 2009
205.061K
-3.787K
-1.81%
jan 1, 2010
201.884K
-3.177K
-1.55%
jan 1, 2011
212.418K
+10.534K
5.22%
jan 1, 2012
200.144K
-12.275K
-5.78%
jan 1, 2013
195.874K
-4.27K
-2.13%
Ranking of countries by current statistics by years


Comments: