29
/
en
AIzaSyAYiBZKx7MnpbEhh9jyipgxe19OcubqV5w
April 1, 2024
271755
Tuvalu
TUV
true
2
1
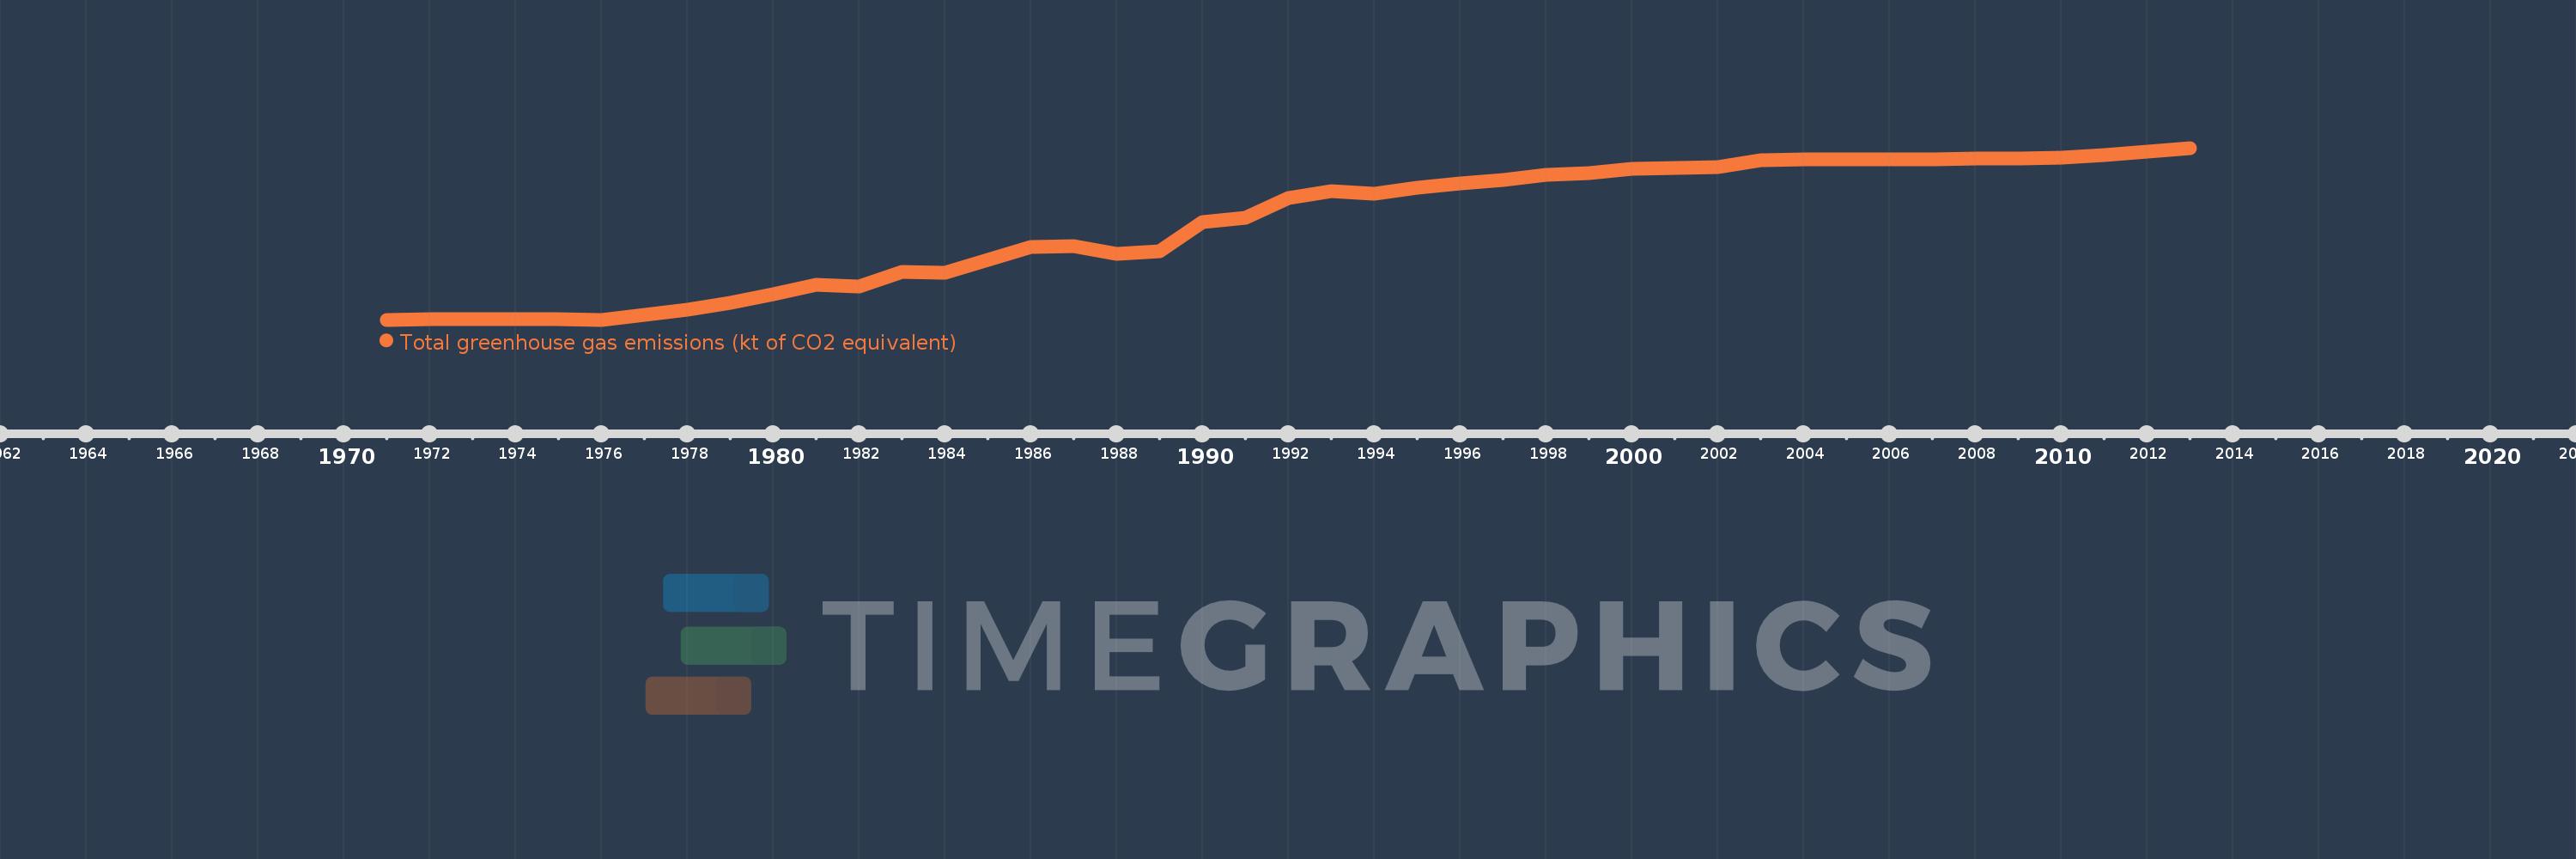
Total greenhouse gas emissions (kt of CO2 equivalent)
2013,2012,2011,2010,2009,2008,2007,2006,2005,2004,2003,2002,2001,2000,1999,1998,1997,1996,1995,1994,1993,1992,1991,1990,1989,1988,1987,1986,1985,1984,1983,1982,1981,1980,1979,1978,1977,1976,1975,1974,1973,1972,1971
This statistics in other country:
AfghanistanAlbaniaAlgeriaAmerican SamoaAngolaAntigua and BarbudaArab WorldArgentinaArmeniaArubaAustraliaAustriaAzerbaijanBahamas, TheBahrainBangladeshBarbadosBelarusBelgiumBelizeBeninBermudaBhutanBoliviaBosnia and HerzegovinaBotswanaBrazilBritish Virgin IslandsBrunei DarussalamBulgariaBurkina FasoBurundiCabo VerdeCambodiaCameroonCanadaCaribbean small statesCayman IslandsCentral African RepublicCentral Europe and the BalticsChadChileChinaColombiaComorosCongo, Dem. Rep.Congo, Rep.Costa RicaCote d'IvoireCroatiaCubaCyprusCzech RepublicDenmarkDjiboutiDominicaDominican RepublicEarly-demographic dividendEast Asia & PacificEast Asia & Pacific (excluding high income)East Asia & Pacific (IDA & IBRD countries)EcuadorEgypt, Arab Rep.El SalvadorEquatorial GuineaEritreaEstoniaEthiopiaEuro areaEurope & Central AsiaEurope & Central Asia (excluding high income)Europe & Central Asia (IDA & IBRD countries)European UnionFijiFinlandFragile and conflict affected situationsFranceFrench PolynesiaGabonGambia, TheGeorgiaGermanyGhanaGibraltarGreeceGrenadaGuamGuatemalaGuineaGuinea-BissauGuyanaHaitiHeavily indebted poor countries (HIPC)High incomeHondurasHong Kong SAR, ChinaHungaryIBRD onlyIcelandIDA & IBRD totalIDA blendIDA onlyIDA totalIndiaIndonesiaIran, Islamic Rep.IraqIrelandIsraelItalyJamaicaJapanJordanKazakhstanKenyaKiribatiKorea, Dem. People’s Rep.Korea, Rep.KuwaitKyrgyz RepublicLao PDRLate-demographic dividendLatin America & Caribbean Latin America & Caribbean (excluding high income)Latin America & the Caribbean (IDA & IBRD countries)LatviaLeast developed countries: UN classificationLebanonLesothoLiberiaLibyaLithuaniaLow & middle incomeLow incomeLower middle incomeLuxembourgMacao SAR, ChinaMacedonia, FYRMadagascarMalawiMalaysiaMaldivesMaliMaltaMarshall IslandsMauritaniaMauritiusMexicoMicronesia, Fed. Sts.Middle East & North AfricaMiddle East & North Africa (excluding high income)Middle East & North Africa (IDA & IBRD countries)Middle incomeMoldovaMongoliaMoroccoMozambiqueMyanmarNamibiaNepalNetherlandsNew CaledoniaNew ZealandNicaraguaNigerNigeriaNorth AmericaNorthern Mariana IslandsNorwayOECD membersOmanOther small statesPacific island small statesPakistanPanamaPapua New GuineaParaguayPeruPhilippinesPolandPortugalPost-demographic dividendPre-demographic dividendPuerto RicoQatarRomaniaRussian FederationRwandaSamoaSao Tome and PrincipeSaudi ArabiaSenegalSeychellesSierra LeoneSingaporeSlovak RepublicSloveniaSmall statesSolomon IslandsSomaliaSouth AfricaSouth AsiaSouth Asia (IDA & IBRD)SpainSri LankaSt. Kitts and NevisSt. LuciaSt. Vincent and the GrenadinesSub-Saharan Africa Sub-Saharan Africa (excluding high income)Sub-Saharan Africa (IDA & IBRD countries)SudanSurinameSwazilandSwedenSwitzerlandSyrian Arab RepublicTajikistanTanzaniaThailandTimor-LesteTogoTongaTrinidad and TobagoTunisiaTurkeyTurkmenistanTurks and Caicos IslandsTuvaluUgandaUkraineUnited Arab EmiratesUnited KingdomUnited StatesUpper middle incomeUruguayUzbekistanVanuatuVenezuela, RBVietnamVirgin Islands (U.S.)WorldYemen, Rep.ZambiaZimbabwe Timeline:
This timeline shows a graph from 1971 to 2013 of Tuvalu. No data until 1970. Number of actual observations by date: 43.
Source name:
World Development Indicators
Source organization:
European Commission, Joint Research Centre (JRC)/Netherlands Environmental Assessment Agency (PBL). Emission Database for Global Atmospheric Research (EDGAR), EDGARv4.2 FT2012: http://edgar.jrc.ec.europa.eu/
Categories, topics:
Climate Change, Environment
Last updated:
apr 23, 2017
Indicators value changes by year
At the date of observation
Value
Absolute change
Change from previous value
jan 1, 1971
2.266
+2.266
0.0%
jan 1, 1972
2.27
+0.004
0.2%
jan 1, 1973
2.273
+0.003
0.11%
jan 1, 1974
2.275
+0.002
0.09%
jan 1, 1975
2.273
-0.002
-0.08%
jan 1, 1976
2.265
-0.008
-0.34%
jan 1, 1977
2.344
+0.079
3.48%
jan 1, 1978
2.446
+0.102
4.36%
jan 1, 1979
2.551
+0.105
4.3%
jan 1, 1980
2.703
+0.151
5.93%
jan 1, 1981
2.864
+0.161
5.97%
jan 1, 1982
2.846
-0.018
-0.62%
jan 1, 1983
3.093
+0.247
8.68%
jan 1, 1984
3.073
-0.02
-0.64%
jan 1, 1985
3.308
+0.235
7.63%
jan 1, 1986
3.519
+0.211
6.39%
jan 1, 1987
3.533
+0.014
0.4%
jan 1, 1988
3.399
-0.134
-3.8%
jan 1, 1989
3.456
+0.057
1.67%
jan 1, 1990
3.955
+0.499
14.45%
jan 1, 1991
4.032
+0.077
1.95%
jan 1, 1992
4.369
+0.337
8.36%
jan 1, 1993
4.488
+0.119
2.73%
jan 1, 1994
4.447
-0.041
-0.92%
jan 1, 1995
4.551
+0.104
2.35%
jan 1, 1996
4.631
+0.08
1.75%
jan 1, 1997
4.678
+0.047
1.01%
jan 1, 1998
4.775
+0.097
2.08%
jan 1, 1999
4.801
+0.026
0.54%
jan 1, 2000
4.882
+0.081
1.69%
jan 1, 2001
4.897
+0.015
0.3%
jan 1, 2002
4.907
+0.01
0.21%
jan 1, 2003
5.034
+0.127
2.59%
jan 1, 2004
5.041
+0.007
0.14%
jan 1, 2005
5.04
-0.001
-0.03%
jan 1, 2006
5.043
+0.003
0.06%
jan 1, 2007
5.045
+0.002
0.05%
jan 1, 2008
5.053
+0.008
0.16%
jan 1, 2009
5.063
+0.01
0.19%
jan 1, 2010
5.068
+0.006
0.11%
jan 1, 2011
5.11
+0.041
0.82%
jan 1, 2012
5.176
+0.066
1.3%
jan 1, 2013
5.24
+0.064
1.24%
Ranking of countries by current statistics by years


Comments: