29
/
en
AIzaSyAYiBZKx7MnpbEhh9jyipgxe19OcubqV5w
April 1, 2024
69335
Antigua and Barbuda
ATG
true
2
1
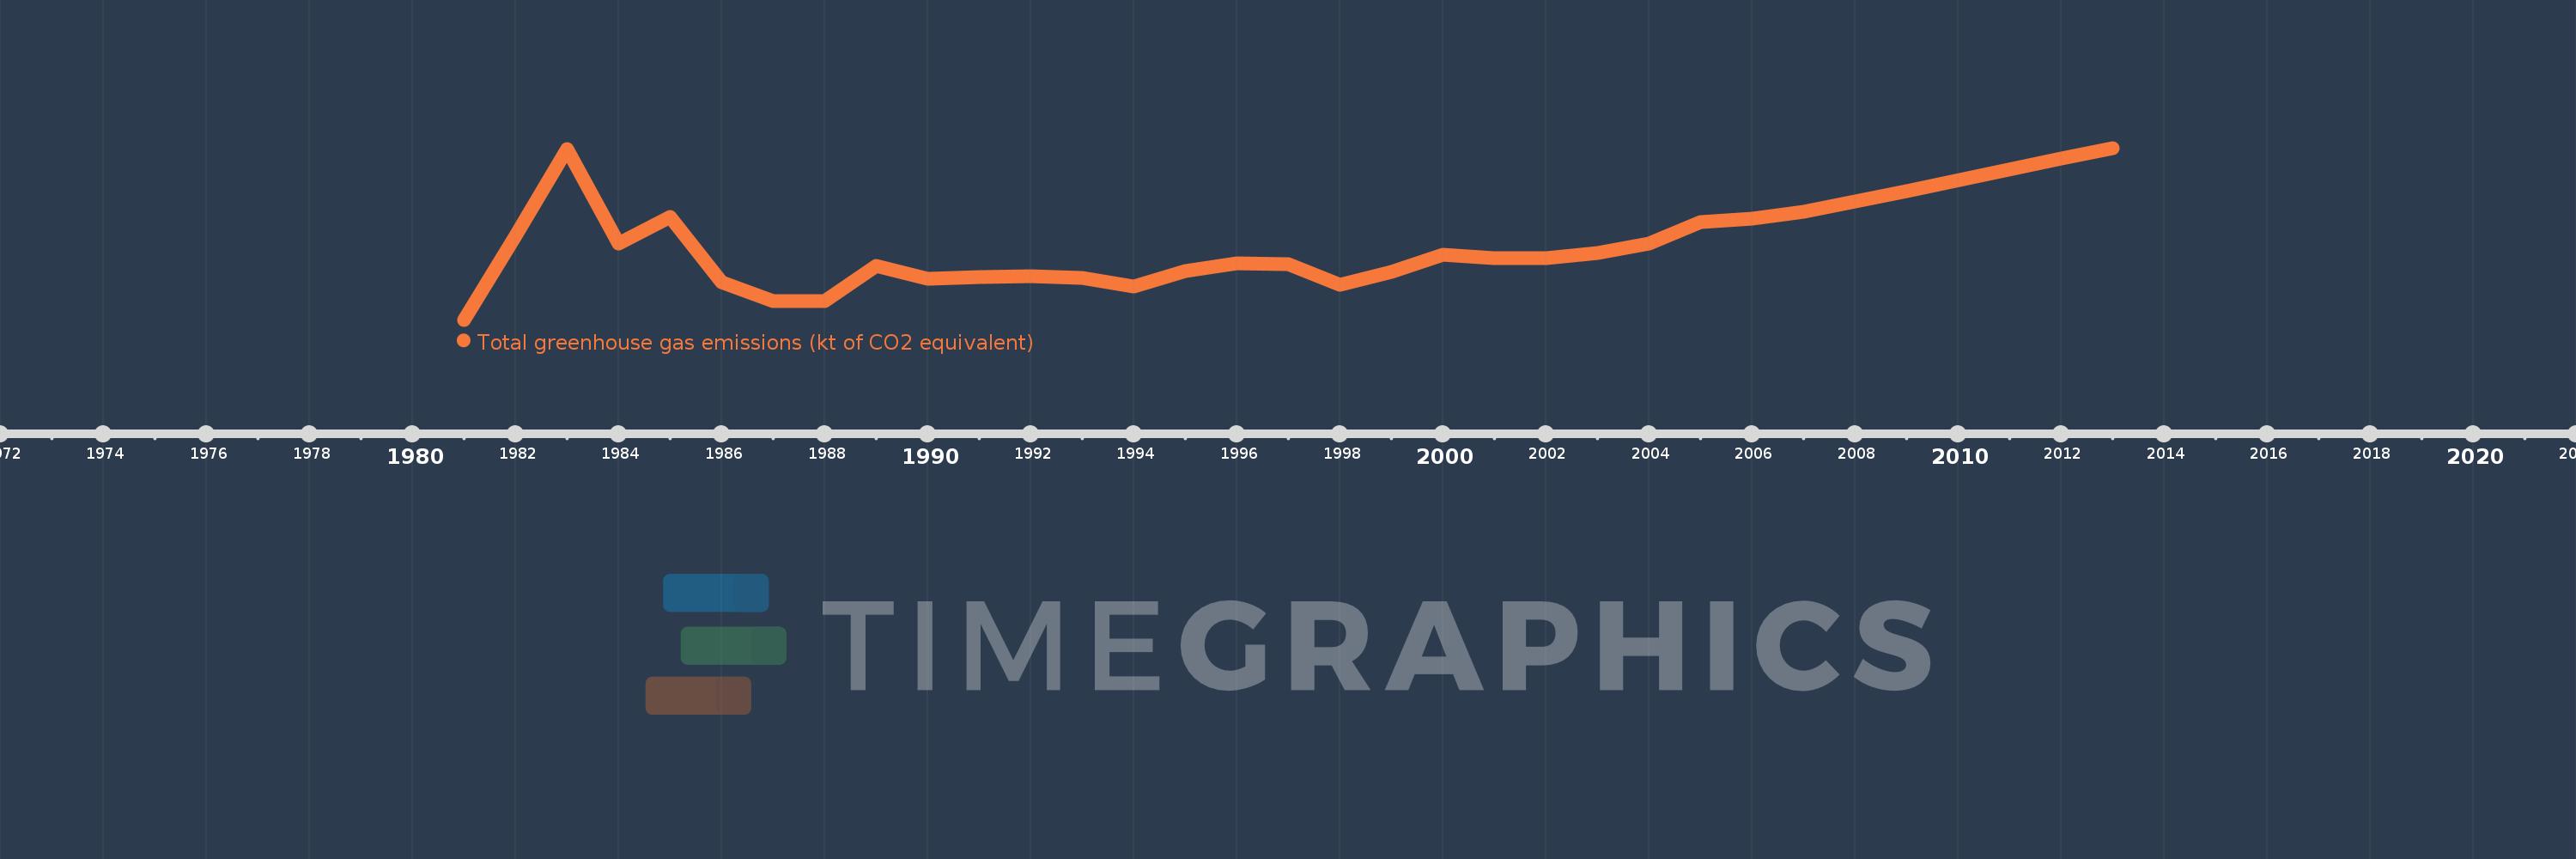
Total greenhouse gas emissions (kt of CO2 equivalent)
2013,2012,2009,2008,2007,2006,2005,2004,2003,2002,2001,2000,1999,1998,1997,1996,1995,1994,1993,1992,1991,1990,1989,1988,1987,1986,1985,1984,1983,1982,1981
This statistics in other country:
AfghanistanAlbaniaAlgeriaAmerican SamoaAngolaAntigua and BarbudaArab WorldArgentinaArmeniaArubaAustraliaAustriaAzerbaijanBahamas, TheBahrainBangladeshBarbadosBelarusBelgiumBelizeBeninBermudaBhutanBoliviaBosnia and HerzegovinaBotswanaBrazilBritish Virgin IslandsBrunei DarussalamBulgariaBurkina FasoBurundiCabo VerdeCambodiaCameroonCanadaCaribbean small statesCayman IslandsCentral African RepublicCentral Europe and the BalticsChadChileChinaColombiaComorosCongo, Dem. Rep.Congo, Rep.Costa RicaCote d'IvoireCroatiaCubaCyprusCzech RepublicDenmarkDjiboutiDominicaDominican RepublicEarly-demographic dividendEast Asia & PacificEast Asia & Pacific (excluding high income)East Asia & Pacific (IDA & IBRD countries)EcuadorEgypt, Arab Rep.El SalvadorEquatorial GuineaEritreaEstoniaEthiopiaEuro areaEurope & Central AsiaEurope & Central Asia (excluding high income)Europe & Central Asia (IDA & IBRD countries)European UnionFijiFinlandFragile and conflict affected situationsFranceFrench PolynesiaGabonGambia, TheGeorgiaGermanyGhanaGibraltarGreeceGrenadaGuamGuatemalaGuineaGuinea-BissauGuyanaHaitiHeavily indebted poor countries (HIPC)High incomeHondurasHong Kong SAR, ChinaHungaryIBRD onlyIcelandIDA & IBRD totalIDA blendIDA onlyIDA totalIndiaIndonesiaIran, Islamic Rep.IraqIrelandIsraelItalyJamaicaJapanJordanKazakhstanKenyaKiribatiKorea, Dem. People’s Rep.Korea, Rep.KuwaitKyrgyz RepublicLao PDRLate-demographic dividendLatin America & Caribbean Latin America & Caribbean (excluding high income)Latin America & the Caribbean (IDA & IBRD countries)LatviaLeast developed countries: UN classificationLebanonLesothoLiberiaLibyaLithuaniaLow & middle incomeLow incomeLower middle incomeLuxembourgMacao SAR, ChinaMacedonia, FYRMadagascarMalawiMalaysiaMaldivesMaliMaltaMarshall IslandsMauritaniaMauritiusMexicoMicronesia, Fed. Sts.Middle East & North AfricaMiddle East & North Africa (excluding high income)Middle East & North Africa (IDA & IBRD countries)Middle incomeMoldovaMongoliaMoroccoMozambiqueMyanmarNamibiaNepalNetherlandsNew CaledoniaNew ZealandNicaraguaNigerNigeriaNorth AmericaNorthern Mariana IslandsNorwayOECD membersOmanOther small statesPacific island small statesPakistanPanamaPapua New GuineaParaguayPeruPhilippinesPolandPortugalPost-demographic dividendPre-demographic dividendPuerto RicoQatarRomaniaRussian FederationRwandaSamoaSao Tome and PrincipeSaudi ArabiaSenegalSeychellesSierra LeoneSingaporeSlovak RepublicSloveniaSmall statesSolomon IslandsSomaliaSouth AfricaSouth AsiaSouth Asia (IDA & IBRD)SpainSri LankaSt. Kitts and NevisSt. LuciaSt. Vincent and the GrenadinesSub-Saharan Africa Sub-Saharan Africa (excluding high income)Sub-Saharan Africa (IDA & IBRD countries)SudanSurinameSwazilandSwedenSwitzerlandSyrian Arab RepublicTajikistanTanzaniaThailandTimor-LesteTogoTongaTrinidad and TobagoTunisiaTurkeyTurkmenistanTurks and Caicos IslandsTuvaluUgandaUkraineUnited Arab EmiratesUnited KingdomUnited StatesUpper middle incomeUruguayUzbekistanVanuatuVenezuela, RBVietnamVirgin Islands (U.S.)WorldYemen, Rep.ZambiaZimbabwe Timeline:
This timeline shows a graph from 1981 to 2013 of Antigua and Barbuda. No data until 1980. Number of actual observations by date: 31.
Source name:
World Development Indicators
Source organization:
European Commission, Joint Research Centre (JRC)/Netherlands Environmental Assessment Agency (PBL). Emission Database for Global Atmospheric Research (EDGAR), EDGARv4.2 FT2012: http://edgar.jrc.ec.europa.eu/
Categories, topics:
Climate Change, Environment
Last updated:
apr 23, 2017
Indicators value changes by year
Minimum:
313.033
jan 1, 1981
Maximum:
552.748
jan 1, 2013
At the date of observation
Value
Absolute change
Change from previous value
jan 1, 1981
313.033
+313.033
0.0%
jan 1, 1982
430.109
+117.076
37.4%
jan 1, 1983
551.337
+121.228
28.19%
jan 1, 1984
419.441
-131.896
-23.92%
jan 1, 1985
456.247
+36.806
8.78%
jan 1, 1986
365.081
-91.166
-19.98%
jan 1, 1987
339.58
-25.502
-6.99%
jan 1, 1988
339.578
-0.002
0.0%
jan 1, 1989
387.778
+48.2
14.19%
jan 1, 1990
370.511
-17.267
-4.45%
jan 1, 1991
372.288
+1.776
0.48%
jan 1, 1992
373.358
+1.07
0.29%
jan 1, 1993
371.52
-1.839
-0.49%
jan 1, 1994
359.195
-12.325
-3.32%
jan 1, 1995
380.852
+21.657
6.03%
jan 1, 1996
391.944
+11.092
2.91%
jan 1, 1997
390.01
-1.934
-0.49%
jan 1, 1998
362.381
-27.629
-7.08%
jan 1, 1999
379.422
+17.041
4.7%
jan 1, 2000
404.099
+24.677
6.5%
jan 1, 2001
398.694
-5.405
-1.34%
jan 1, 2002
399.265
+0.571
0.14%
jan 1, 2003
406.432
+7.167
1.8%
jan 1, 2004
418.838
+12.406
3.05%
jan 1, 2005
449.002
+30.165
7.2%
jan 1, 2006
454.071
+5.068
1.13%
jan 1, 2007
463.566
+9.495
2.09%
jan 1, 2008
478.084
+14.518
3.13%
jan 1, 2009
491.897
+13.814
2.89%
jan 1, 2012
537.806
+45.908
9.33%
jan 1, 2013
552.748
+14.942
2.78%
Ranking of countries by current statistics by years


Comments: