29
/
en
AIzaSyAYiBZKx7MnpbEhh9jyipgxe19OcubqV5w
April 1, 2024
205927
Namibia
NAM
true
2
1
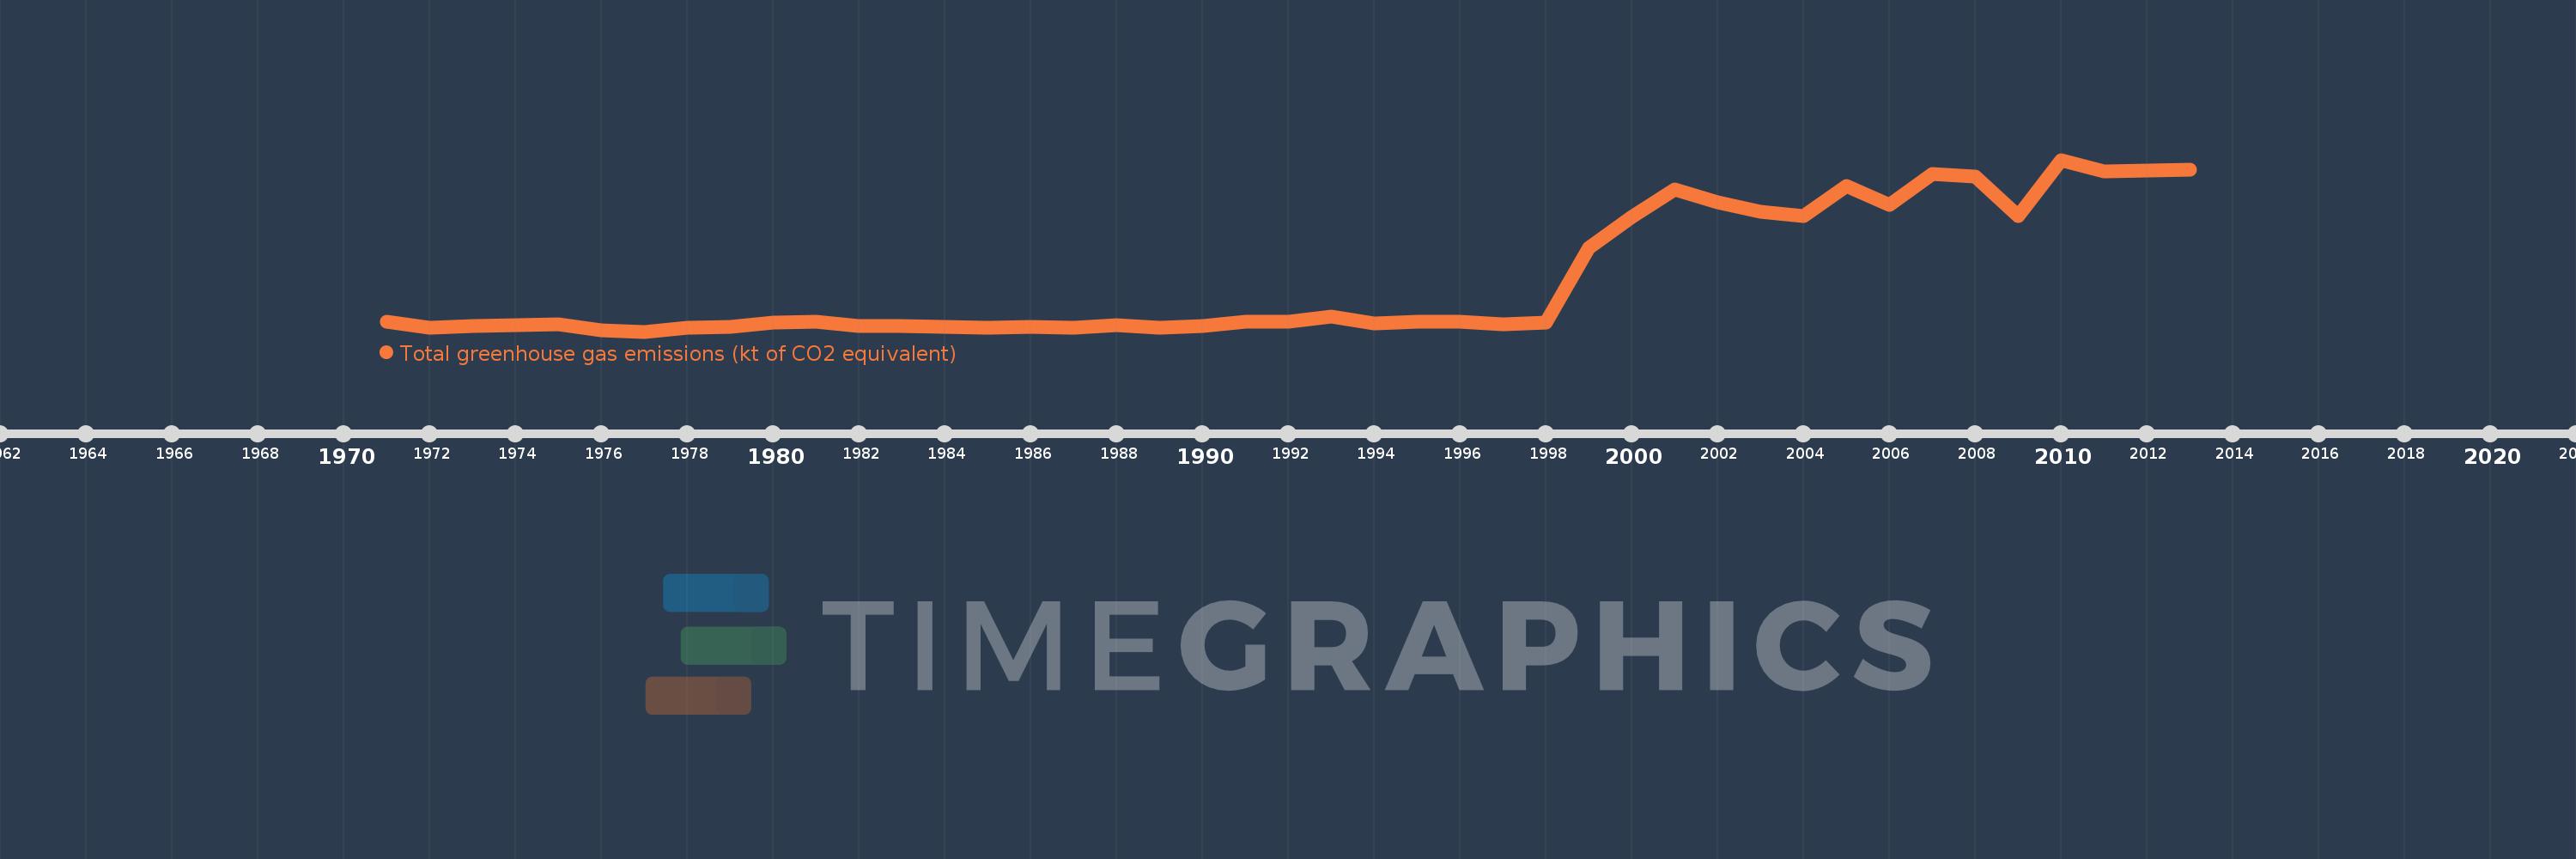
Total greenhouse gas emissions (kt of CO2 equivalent)
2013,2012,2011,2010,2009,2008,2007,2006,2005,2004,2003,2002,2001,2000,1999,1998,1997,1996,1995,1994,1993,1992,1991,1990,1989,1988,1987,1986,1985,1984,1983,1982,1981,1980,1979,1978,1977,1976,1975,1974,1973,1972,1971
This statistics in other country:
AfghanistanAlbaniaAlgeriaAmerican SamoaAngolaAntigua and BarbudaArab WorldArgentinaArmeniaArubaAustraliaAustriaAzerbaijanBahamas, TheBahrainBangladeshBarbadosBelarusBelgiumBelizeBeninBermudaBhutanBoliviaBosnia and HerzegovinaBotswanaBrazilBritish Virgin IslandsBrunei DarussalamBulgariaBurkina FasoBurundiCabo VerdeCambodiaCameroonCanadaCaribbean small statesCayman IslandsCentral African RepublicCentral Europe and the BalticsChadChileChinaColombiaComorosCongo, Dem. Rep.Congo, Rep.Costa RicaCote d'IvoireCroatiaCubaCyprusCzech RepublicDenmarkDjiboutiDominicaDominican RepublicEarly-demographic dividendEast Asia & PacificEast Asia & Pacific (excluding high income)East Asia & Pacific (IDA & IBRD countries)EcuadorEgypt, Arab Rep.El SalvadorEquatorial GuineaEritreaEstoniaEthiopiaEuro areaEurope & Central AsiaEurope & Central Asia (excluding high income)Europe & Central Asia (IDA & IBRD countries)European UnionFijiFinlandFragile and conflict affected situationsFranceFrench PolynesiaGabonGambia, TheGeorgiaGermanyGhanaGibraltarGreeceGrenadaGuamGuatemalaGuineaGuinea-BissauGuyanaHaitiHeavily indebted poor countries (HIPC)High incomeHondurasHong Kong SAR, ChinaHungaryIBRD onlyIcelandIDA & IBRD totalIDA blendIDA onlyIDA totalIndiaIndonesiaIran, Islamic Rep.IraqIrelandIsraelItalyJamaicaJapanJordanKazakhstanKenyaKiribatiKorea, Dem. People’s Rep.Korea, Rep.KuwaitKyrgyz RepublicLao PDRLate-demographic dividendLatin America & Caribbean Latin America & Caribbean (excluding high income)Latin America & the Caribbean (IDA & IBRD countries)LatviaLeast developed countries: UN classificationLebanonLesothoLiberiaLibyaLithuaniaLow & middle incomeLow incomeLower middle incomeLuxembourgMacao SAR, ChinaMacedonia, FYRMadagascarMalawiMalaysiaMaldivesMaliMaltaMarshall IslandsMauritaniaMauritiusMexicoMicronesia, Fed. Sts.Middle East & North AfricaMiddle East & North Africa (excluding high income)Middle East & North Africa (IDA & IBRD countries)Middle incomeMoldovaMongoliaMoroccoMozambiqueMyanmarNamibiaNepalNetherlandsNew CaledoniaNew ZealandNicaraguaNigerNigeriaNorth AmericaNorthern Mariana IslandsNorwayOECD membersOmanOther small statesPacific island small statesPakistanPanamaPapua New GuineaParaguayPeruPhilippinesPolandPortugalPost-demographic dividendPre-demographic dividendPuerto RicoQatarRomaniaRussian FederationRwandaSamoaSao Tome and PrincipeSaudi ArabiaSenegalSeychellesSierra LeoneSingaporeSlovak RepublicSloveniaSmall statesSolomon IslandsSomaliaSouth AfricaSouth AsiaSouth Asia (IDA & IBRD)SpainSri LankaSt. Kitts and NevisSt. LuciaSt. Vincent and the GrenadinesSub-Saharan Africa Sub-Saharan Africa (excluding high income)Sub-Saharan Africa (IDA & IBRD countries)SudanSurinameSwazilandSwedenSwitzerlandSyrian Arab RepublicTajikistanTanzaniaThailandTimor-LesteTogoTongaTrinidad and TobagoTunisiaTurkeyTurkmenistanTurks and Caicos IslandsTuvaluUgandaUkraineUnited Arab EmiratesUnited KingdomUnited StatesUpper middle incomeUruguayUzbekistanVanuatuVenezuela, RBVietnamVirgin Islands (U.S.)WorldYemen, Rep.ZambiaZimbabwe Timeline:
This timeline shows a graph from 1971 to 2013 of Namibia. No data until 1970. Number of actual observations by date: 43.
Source name:
World Development Indicators
Source organization:
European Commission, Joint Research Centre (JRC)/Netherlands Environmental Assessment Agency (PBL). Emission Database for Global Atmospheric Research (EDGAR), EDGARv4.2 FT2012: http://edgar.jrc.ec.europa.eu/
Categories, topics:
Climate Change, Environment
Last updated:
apr 23, 2017
Indicators value changes by year
Minimum:
5.289K
jan 1, 1977
Maximum:
39.972K
jan 1, 2010
At the date of observation
Value
Absolute change
Change from previous value
jan 1, 1971
7.251K
+7.251K
0.0%
jan 1, 1972
6.119K
-1.132K
-15.61%
jan 1, 1973
6.338K
+218.583
3.57%
jan 1, 1974
6.534K
+196.015
3.09%
jan 1, 1975
6.813K
+278.683
4.27%
jan 1, 1976
5.483K
-1.33K
-19.52%
jan 1, 1977
5.289K
-194.317
-3.54%
jan 1, 1978
6.14K
+851.136
16.09%
jan 1, 1979
6.272K
+132.522
2.16%
jan 1, 1980
7.142K
+870.018
13.87%
jan 1, 1981
7.327K
+184.999
2.59%
jan 1, 1982
6.432K
-895.752
-12.22%
jan 1, 1983
6.391K
-40.525
-0.63%
jan 1, 1984
6.234K
-156.688
-2.45%
jan 1, 1985
6.042K
-192.661
-3.09%
jan 1, 1986
6.289K
+247.049
4.09%
jan 1, 1987
6.034K
-254.561
-4.05%
jan 1, 1988
6.507K
+472.587
7.83%
jan 1, 1989
6.147K
-359.443
-5.52%
jan 1, 1990
6.404K
+256.777
4.18%
jan 1, 1991
7.3K
+895.765
13.99%
jan 1, 1992
7.247K
-53.139
-0.73%
jan 1, 1993
8.369K
+1.123K
15.49%
jan 1, 1994
6.905K
-1.465K
-17.5%
jan 1, 1995
7.3K
+395.153
5.72%
jan 1, 1996
7.245K
-54.756
-0.75%
jan 1, 1997
6.717K
-528.088
-7.29%
jan 1, 1998
7.025K
+307.73
4.58%
jan 1, 1999
22.239K
+15.214K
216.59%
jan 1, 2000
28.387K
+6.148K
27.64%
jan 1, 2001
33.985K
+5.599K
19.72%
jan 1, 2002
31.359K
-2.626K
-7.73%
jan 1, 2003
29.497K
-1.862K
-5.94%
jan 1, 2004
28.634K
-863.131
-2.93%
jan 1, 2005
34.751K
+6.117K
21.36%
jan 1, 2006
30.934K
-3.817K
-10.98%
jan 1, 2007
37.086K
+6.152K
19.89%
jan 1, 2008
36.561K
-524.596
-1.41%
jan 1, 2009
28.595K
-7.966K
-21.79%
jan 1, 2010
39.972K
+11.376K
39.78%
jan 1, 2011
37.648K
-2.324K
-5.81%
jan 1, 2012
37.856K
+208.08
0.55%
jan 1, 2013
38.049K
+193.619
0.51%
Ranking of countries by current statistics by years


Comments: