29
/
en
AIzaSyAYiBZKx7MnpbEhh9jyipgxe19OcubqV5w
April 1, 2024
231824
Rwanda
RWA
true
2
1
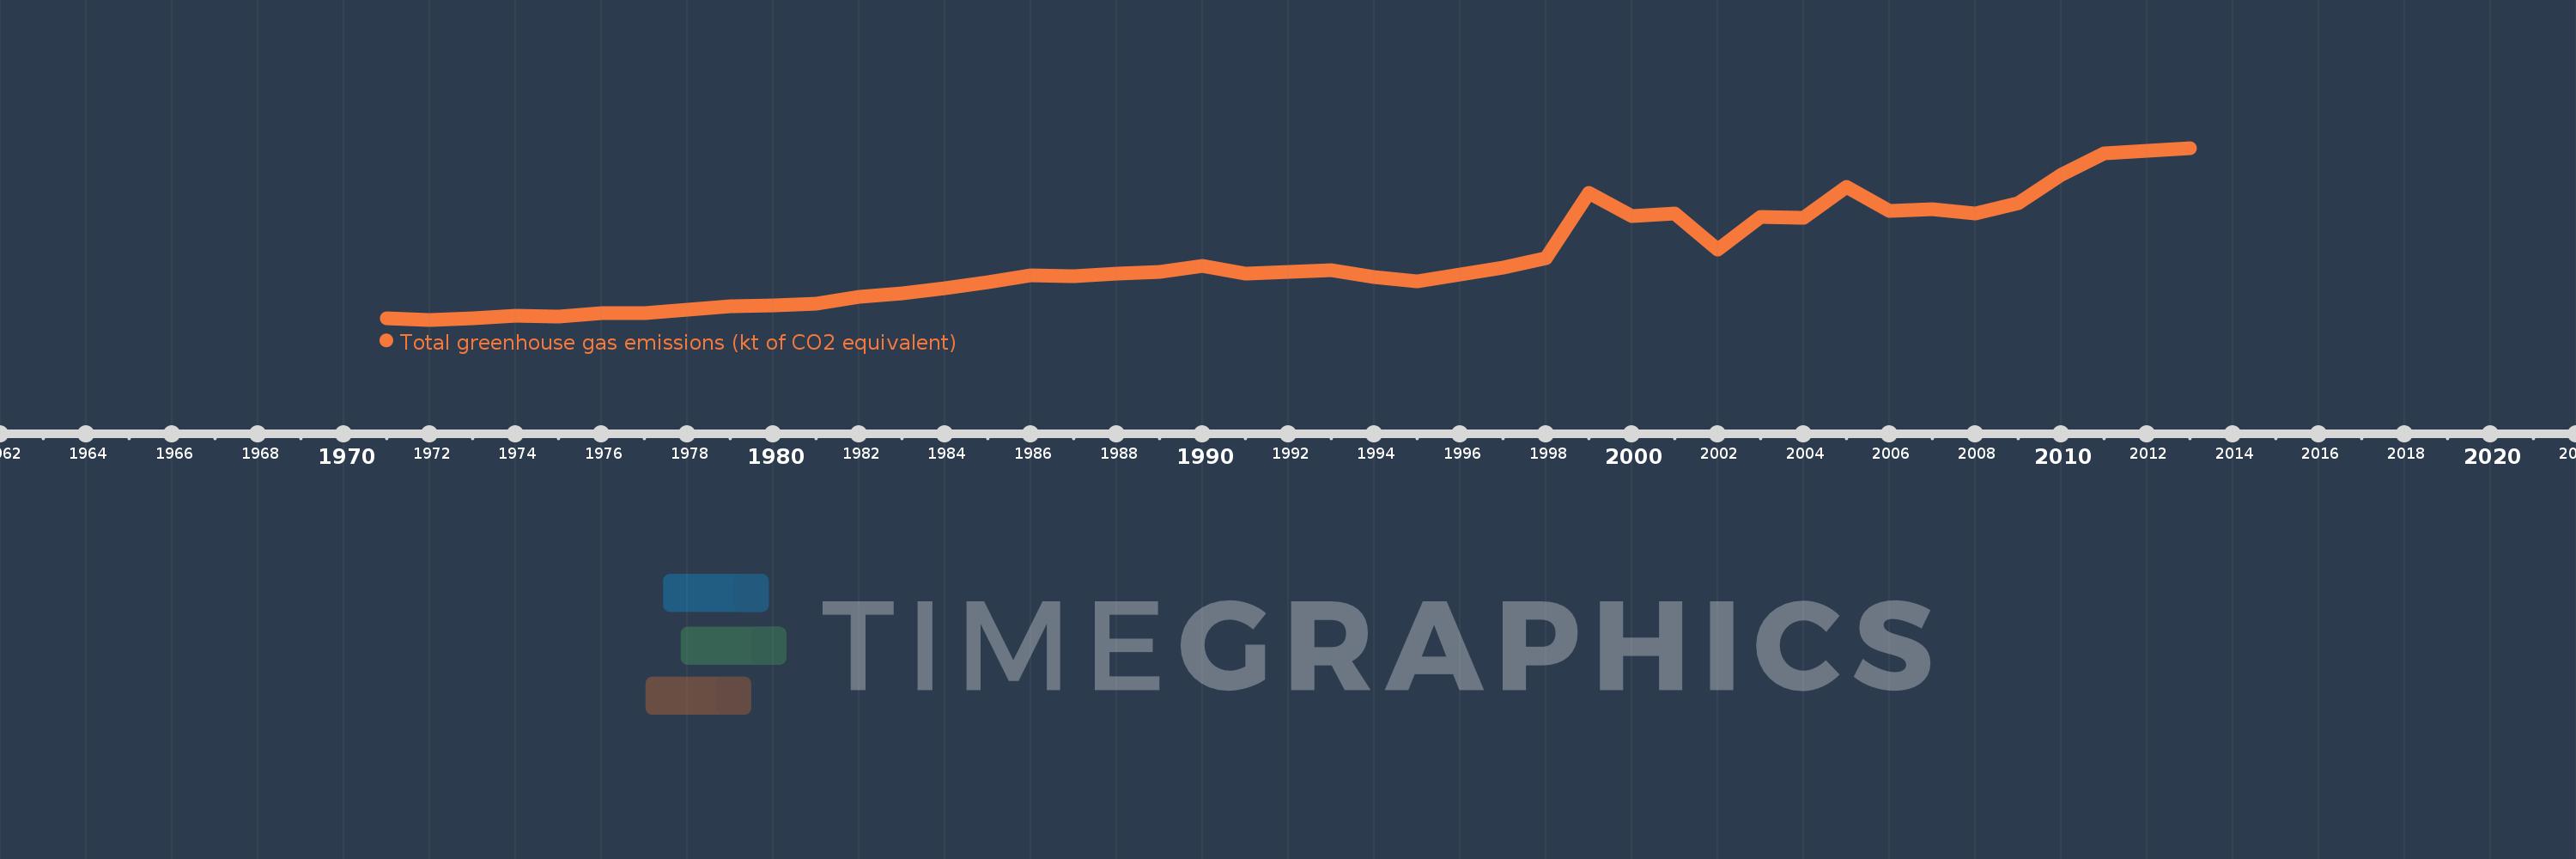
Total greenhouse gas emissions (kt of CO2 equivalent)
2013,2012,2011,2010,2009,2008,2007,2006,2005,2004,2003,2002,2001,2000,1999,1998,1997,1996,1995,1994,1993,1992,1991,1990,1989,1988,1987,1986,1985,1984,1983,1982,1981,1980,1979,1978,1977,1976,1975,1974,1973,1972,1971
This statistics in other country:
AfghanistanAlbaniaAlgeriaAmerican SamoaAngolaAntigua and BarbudaArab WorldArgentinaArmeniaArubaAustraliaAustriaAzerbaijanBahamas, TheBahrainBangladeshBarbadosBelarusBelgiumBelizeBeninBermudaBhutanBoliviaBosnia and HerzegovinaBotswanaBrazilBritish Virgin IslandsBrunei DarussalamBulgariaBurkina FasoBurundiCabo VerdeCambodiaCameroonCanadaCaribbean small statesCayman IslandsCentral African RepublicCentral Europe and the BalticsChadChileChinaColombiaComorosCongo, Dem. Rep.Congo, Rep.Costa RicaCote d'IvoireCroatiaCubaCyprusCzech RepublicDenmarkDjiboutiDominicaDominican RepublicEarly-demographic dividendEast Asia & PacificEast Asia & Pacific (excluding high income)East Asia & Pacific (IDA & IBRD countries)EcuadorEgypt, Arab Rep.El SalvadorEquatorial GuineaEritreaEstoniaEthiopiaEuro areaEurope & Central AsiaEurope & Central Asia (excluding high income)Europe & Central Asia (IDA & IBRD countries)European UnionFijiFinlandFragile and conflict affected situationsFranceFrench PolynesiaGabonGambia, TheGeorgiaGermanyGhanaGibraltarGreeceGrenadaGuamGuatemalaGuineaGuinea-BissauGuyanaHaitiHeavily indebted poor countries (HIPC)High incomeHondurasHong Kong SAR, ChinaHungaryIBRD onlyIcelandIDA & IBRD totalIDA blendIDA onlyIDA totalIndiaIndonesiaIran, Islamic Rep.IraqIrelandIsraelItalyJamaicaJapanJordanKazakhstanKenyaKiribatiKorea, Dem. People’s Rep.Korea, Rep.KuwaitKyrgyz RepublicLao PDRLate-demographic dividendLatin America & Caribbean Latin America & Caribbean (excluding high income)Latin America & the Caribbean (IDA & IBRD countries)LatviaLeast developed countries: UN classificationLebanonLesothoLiberiaLibyaLithuaniaLow & middle incomeLow incomeLower middle incomeLuxembourgMacao SAR, ChinaMacedonia, FYRMadagascarMalawiMalaysiaMaldivesMaliMaltaMarshall IslandsMauritaniaMauritiusMexicoMicronesia, Fed. Sts.Middle East & North AfricaMiddle East & North Africa (excluding high income)Middle East & North Africa (IDA & IBRD countries)Middle incomeMoldovaMongoliaMoroccoMozambiqueMyanmarNamibiaNepalNetherlandsNew CaledoniaNew ZealandNicaraguaNigerNigeriaNorth AmericaNorthern Mariana IslandsNorwayOECD membersOmanOther small statesPacific island small statesPakistanPanamaPapua New GuineaParaguayPeruPhilippinesPolandPortugalPost-demographic dividendPre-demographic dividendPuerto RicoQatarRomaniaRussian FederationRwandaSamoaSao Tome and PrincipeSaudi ArabiaSenegalSeychellesSierra LeoneSingaporeSlovak RepublicSloveniaSmall statesSolomon IslandsSomaliaSouth AfricaSouth AsiaSouth Asia (IDA & IBRD)SpainSri LankaSt. Kitts and NevisSt. LuciaSt. Vincent and the GrenadinesSub-Saharan Africa Sub-Saharan Africa (excluding high income)Sub-Saharan Africa (IDA & IBRD countries)SudanSurinameSwazilandSwedenSwitzerlandSyrian Arab RepublicTajikistanTanzaniaThailandTimor-LesteTogoTongaTrinidad and TobagoTunisiaTurkeyTurkmenistanTurks and Caicos IslandsTuvaluUgandaUkraineUnited Arab EmiratesUnited KingdomUnited StatesUpper middle incomeUruguayUzbekistanVanuatuVenezuela, RBVietnamVirgin Islands (U.S.)WorldYemen, Rep.ZambiaZimbabwe Timeline:
This timeline shows a graph from 1971 to 2013 of Rwanda. No data until 1970. Number of actual observations by date: 43.
Source name:
World Development Indicators
Source organization:
European Commission, Joint Research Centre (JRC)/Netherlands Environmental Assessment Agency (PBL). Emission Database for Global Atmospheric Research (EDGAR), EDGARv4.2 FT2012: http://edgar.jrc.ec.europa.eu/
Categories, topics:
Climate Change, Environment
Last updated:
apr 23, 2017
Indicators value changes by year
Minimum:
2.005K
jan 1, 1972
At the date of observation
Value
Absolute change
Change from previous value
jan 1, 1971
2.034K
+2.034K
0.0%
jan 1, 1972
2.005K
-28.845
-1.42%
jan 1, 1973
2.041K
+35.716
1.78%
jan 1, 1974
2.121K
+80.216
3.93%
jan 1, 1975
2.087K
-34.248
-1.61%
jan 1, 1976
2.184K
+96.807
4.64%
jan 1, 1977
2.189K
+5.215
0.24%
jan 1, 1978
2.276K
+86.872
3.97%
jan 1, 1979
2.37K
+94.649
4.16%
jan 1, 1980
2.388K
+17.958
0.76%
jan 1, 1981
2.449K
+60.352
2.53%
jan 1, 1982
2.631K
+181.895
7.43%
jan 1, 1983
2.727K
+96.904
3.68%
jan 1, 1984
2.855K
+127.363
4.67%
jan 1, 1985
3.027K
+171.763
6.02%
jan 1, 1986
3.207K
+180.738
5.97%
jan 1, 1987
3.203K
-4.619
-0.14%
jan 1, 1988
3.272K
+69.367
2.17%
jan 1, 1989
3.307K
+35.266
1.08%
jan 1, 1990
3.476K
+168.361
5.09%
jan 1, 1991
3.252K
-223.729
-6.44%
jan 1, 1992
3.317K
+65.427
2.01%
jan 1, 1993
3.366K
+48.523
1.46%
jan 1, 1994
3.162K
-204.374
-6.07%
jan 1, 1995
3.054K
-108.011
-3.42%
jan 1, 1996
3.232K
+178.157
5.83%
jan 1, 1997
3.42K
+188.715
5.84%
jan 1, 1998
3.683K
+262.437
7.67%
jan 1, 1999
5.454K
+1.771K
48.09%
jan 1, 2000
4.837K
-616.775
-11.31%
jan 1, 2001
4.9K
+63.062
1.3%
jan 1, 2002
3.924K
-976.311
-19.92%
jan 1, 2003
4.806K
+882.264
22.48%
jan 1, 2004
4.794K
-12.476
-0.26%
jan 1, 2005
5.635K
+841.587
17.56%
jan 1, 2006
4.964K
-671.433
-11.91%
jan 1, 2007
5.022K
+57.698
1.16%
jan 1, 2008
4.905K
-117.043
-2.33%
jan 1, 2009
5.184K
+279.125
5.69%
jan 1, 2010
5.967K
+783.319
15.11%
jan 1, 2011
6.547K
+580.413
9.73%
jan 1, 2012
6.62K
+72.772
1.11%
jan 1, 2013
6.69K
+69.702
1.05%
Ranking of countries by current statistics by years


Comments: