29
/
en
AIzaSyAYiBZKx7MnpbEhh9jyipgxe19OcubqV5w
April 1, 2024
85488
Bermuda
BMU
true
2
1
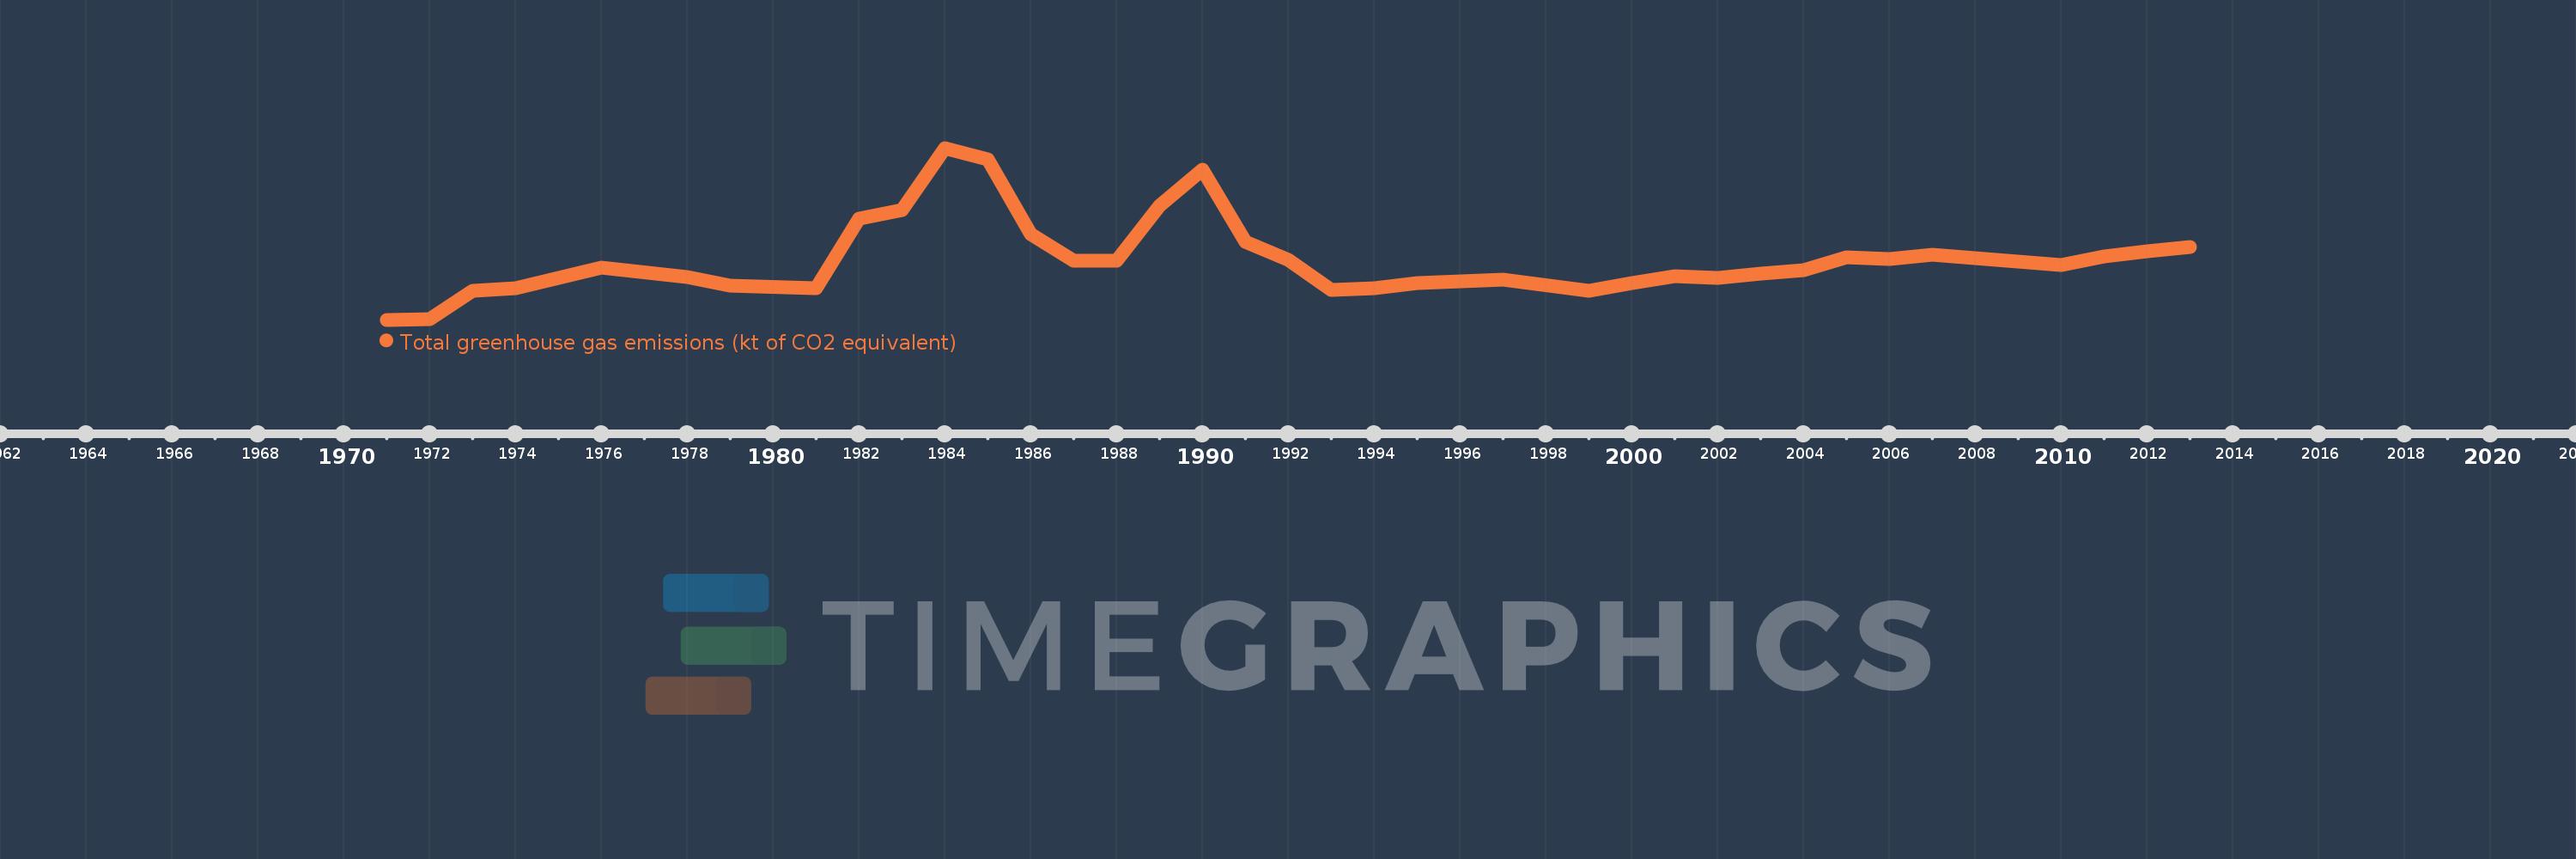
Total greenhouse gas emissions (kt of CO2 equivalent)
2013,2012,2011,2010,2007,2006,2005,2004,2003,2002,2001,2000,1999,1997,1996,1995,1994,1993,1992,1991,1990,1989,1988,1987,1986,1985,1984,1983,1982,1981,1979,1978,1976,1974,1973,1972,1971
This statistics in other country:
AfghanistanAlbaniaAlgeriaAmerican SamoaAngolaAntigua and BarbudaArab WorldArgentinaArmeniaArubaAustraliaAustriaAzerbaijanBahamas, TheBahrainBangladeshBarbadosBelarusBelgiumBelizeBeninBermudaBhutanBoliviaBosnia and HerzegovinaBotswanaBrazilBritish Virgin IslandsBrunei DarussalamBulgariaBurkina FasoBurundiCabo VerdeCambodiaCameroonCanadaCaribbean small statesCayman IslandsCentral African RepublicCentral Europe and the BalticsChadChileChinaColombiaComorosCongo, Dem. Rep.Congo, Rep.Costa RicaCote d'IvoireCroatiaCubaCyprusCzech RepublicDenmarkDjiboutiDominicaDominican RepublicEarly-demographic dividendEast Asia & PacificEast Asia & Pacific (excluding high income)East Asia & Pacific (IDA & IBRD countries)EcuadorEgypt, Arab Rep.El SalvadorEquatorial GuineaEritreaEstoniaEthiopiaEuro areaEurope & Central AsiaEurope & Central Asia (excluding high income)Europe & Central Asia (IDA & IBRD countries)European UnionFijiFinlandFragile and conflict affected situationsFranceFrench PolynesiaGabonGambia, TheGeorgiaGermanyGhanaGibraltarGreeceGrenadaGuamGuatemalaGuineaGuinea-BissauGuyanaHaitiHeavily indebted poor countries (HIPC)High incomeHondurasHong Kong SAR, ChinaHungaryIBRD onlyIcelandIDA & IBRD totalIDA blendIDA onlyIDA totalIndiaIndonesiaIran, Islamic Rep.IraqIrelandIsraelItalyJamaicaJapanJordanKazakhstanKenyaKiribatiKorea, Dem. People’s Rep.Korea, Rep.KuwaitKyrgyz RepublicLao PDRLate-demographic dividendLatin America & Caribbean Latin America & Caribbean (excluding high income)Latin America & the Caribbean (IDA & IBRD countries)LatviaLeast developed countries: UN classificationLebanonLesothoLiberiaLibyaLithuaniaLow & middle incomeLow incomeLower middle incomeLuxembourgMacao SAR, ChinaMacedonia, FYRMadagascarMalawiMalaysiaMaldivesMaliMaltaMarshall IslandsMauritaniaMauritiusMexicoMicronesia, Fed. Sts.Middle East & North AfricaMiddle East & North Africa (excluding high income)Middle East & North Africa (IDA & IBRD countries)Middle incomeMoldovaMongoliaMoroccoMozambiqueMyanmarNamibiaNepalNetherlandsNew CaledoniaNew ZealandNicaraguaNigerNigeriaNorth AmericaNorthern Mariana IslandsNorwayOECD membersOmanOther small statesPacific island small statesPakistanPanamaPapua New GuineaParaguayPeruPhilippinesPolandPortugalPost-demographic dividendPre-demographic dividendPuerto RicoQatarRomaniaRussian FederationRwandaSamoaSao Tome and PrincipeSaudi ArabiaSenegalSeychellesSierra LeoneSingaporeSlovak RepublicSloveniaSmall statesSolomon IslandsSomaliaSouth AfricaSouth AsiaSouth Asia (IDA & IBRD)SpainSri LankaSt. Kitts and NevisSt. LuciaSt. Vincent and the GrenadinesSub-Saharan Africa Sub-Saharan Africa (excluding high income)Sub-Saharan Africa (IDA & IBRD countries)SudanSurinameSwazilandSwedenSwitzerlandSyrian Arab RepublicTajikistanTanzaniaThailandTimor-LesteTogoTongaTrinidad and TobagoTunisiaTurkeyTurkmenistanTurks and Caicos IslandsTuvaluUgandaUkraineUnited Arab EmiratesUnited KingdomUnited StatesUpper middle incomeUruguayUzbekistanVanuatuVenezuela, RBVietnamVirgin Islands (U.S.)WorldYemen, Rep.ZambiaZimbabwe Timeline:
This timeline shows a graph from 1971 to 2013 of Bermuda. No data until 1970. Number of actual observations by date: 37.
Source name:
World Development Indicators
Source organization:
European Commission, Joint Research Centre (JRC)/Netherlands Environmental Assessment Agency (PBL). Emission Database for Global Atmospheric Research (EDGAR), EDGARv4.2 FT2012: http://edgar.jrc.ec.europa.eu/
Categories, topics:
Climate Change, Environment
Last updated:
apr 23, 2017
Indicators value changes by year
Minimum:
349.39
jan 1, 1971
Maximum:
1.016K
jan 1, 1984
At the date of observation
Value
Absolute change
Change from previous value
jan 1, 1971
349.39
+349.39
0.0%
jan 1, 1972
350.068
+0.677
0.19%
jan 1, 1973
463.228
+113.16
32.33%
jan 1, 1974
472.143
+8.915
1.92%
jan 1, 1976
552.503
+80.36
17.02%
jan 1, 1978
514.008
-38.495
-6.97%
jan 1, 1979
481.71
-32.298
-6.28%
jan 1, 1981
470.536
-11.174
-2.32%
jan 1, 1982
740.936
+270.4
57.47%
jan 1, 1983
775.607
+34.671
4.68%
jan 1, 1984
1.016K
+240.568
31.02%
jan 1, 1985
971.146
-45.029
-4.43%
jan 1, 1986
683.181
-287.964
-29.65%
jan 1, 1987
577.379
-105.802
-15.49%
jan 1, 1988
578.209
+0.829
0.14%
jan 1, 1989
792.223
+214.014
37.01%
jan 1, 1990
932.165
+139.942
17.66%
jan 1, 1991
652.962
-279.202
-29.95%
jan 1, 1992
581.548
-71.414
-10.94%
jan 1, 1993
465.68
-115.868
-19.92%
jan 1, 1994
471.026
+5.346
1.15%
jan 1, 1995
491.291
+20.265
4.3%
jan 1, 1996
496.77
+5.479
1.12%
jan 1, 1997
504.097
+7.327
1.47%
jan 1, 1999
461.718
-42.378
-8.41%
jan 1, 2000
492.034
+30.316
6.57%
jan 1, 2001
518.971
+26.938
5.47%
jan 1, 2002
510.111
-8.86
-1.71%
jan 1, 2003
527.096
+16.985
3.33%
jan 1, 2004
543.013
+15.916
3.02%
jan 1, 2005
591.968
+48.955
9.02%
jan 1, 2006
584.756
-7.211
-1.22%
jan 1, 2007
600.515
+15.759
2.69%
jan 1, 2010
561.264
-39.252
-6.54%
jan 1, 2011
594.652
+33.388
5.95%
jan 1, 2012
614.876
+20.224
3.4%
jan 1, 2013
632.877
+18.001
2.93%
Ranking of countries by current statistics by years


Comments: