29
/
en
AIzaSyAYiBZKx7MnpbEhh9jyipgxe19OcubqV5w
April 1, 2024
127906
Equatorial Guinea
GNQ
true
2
1
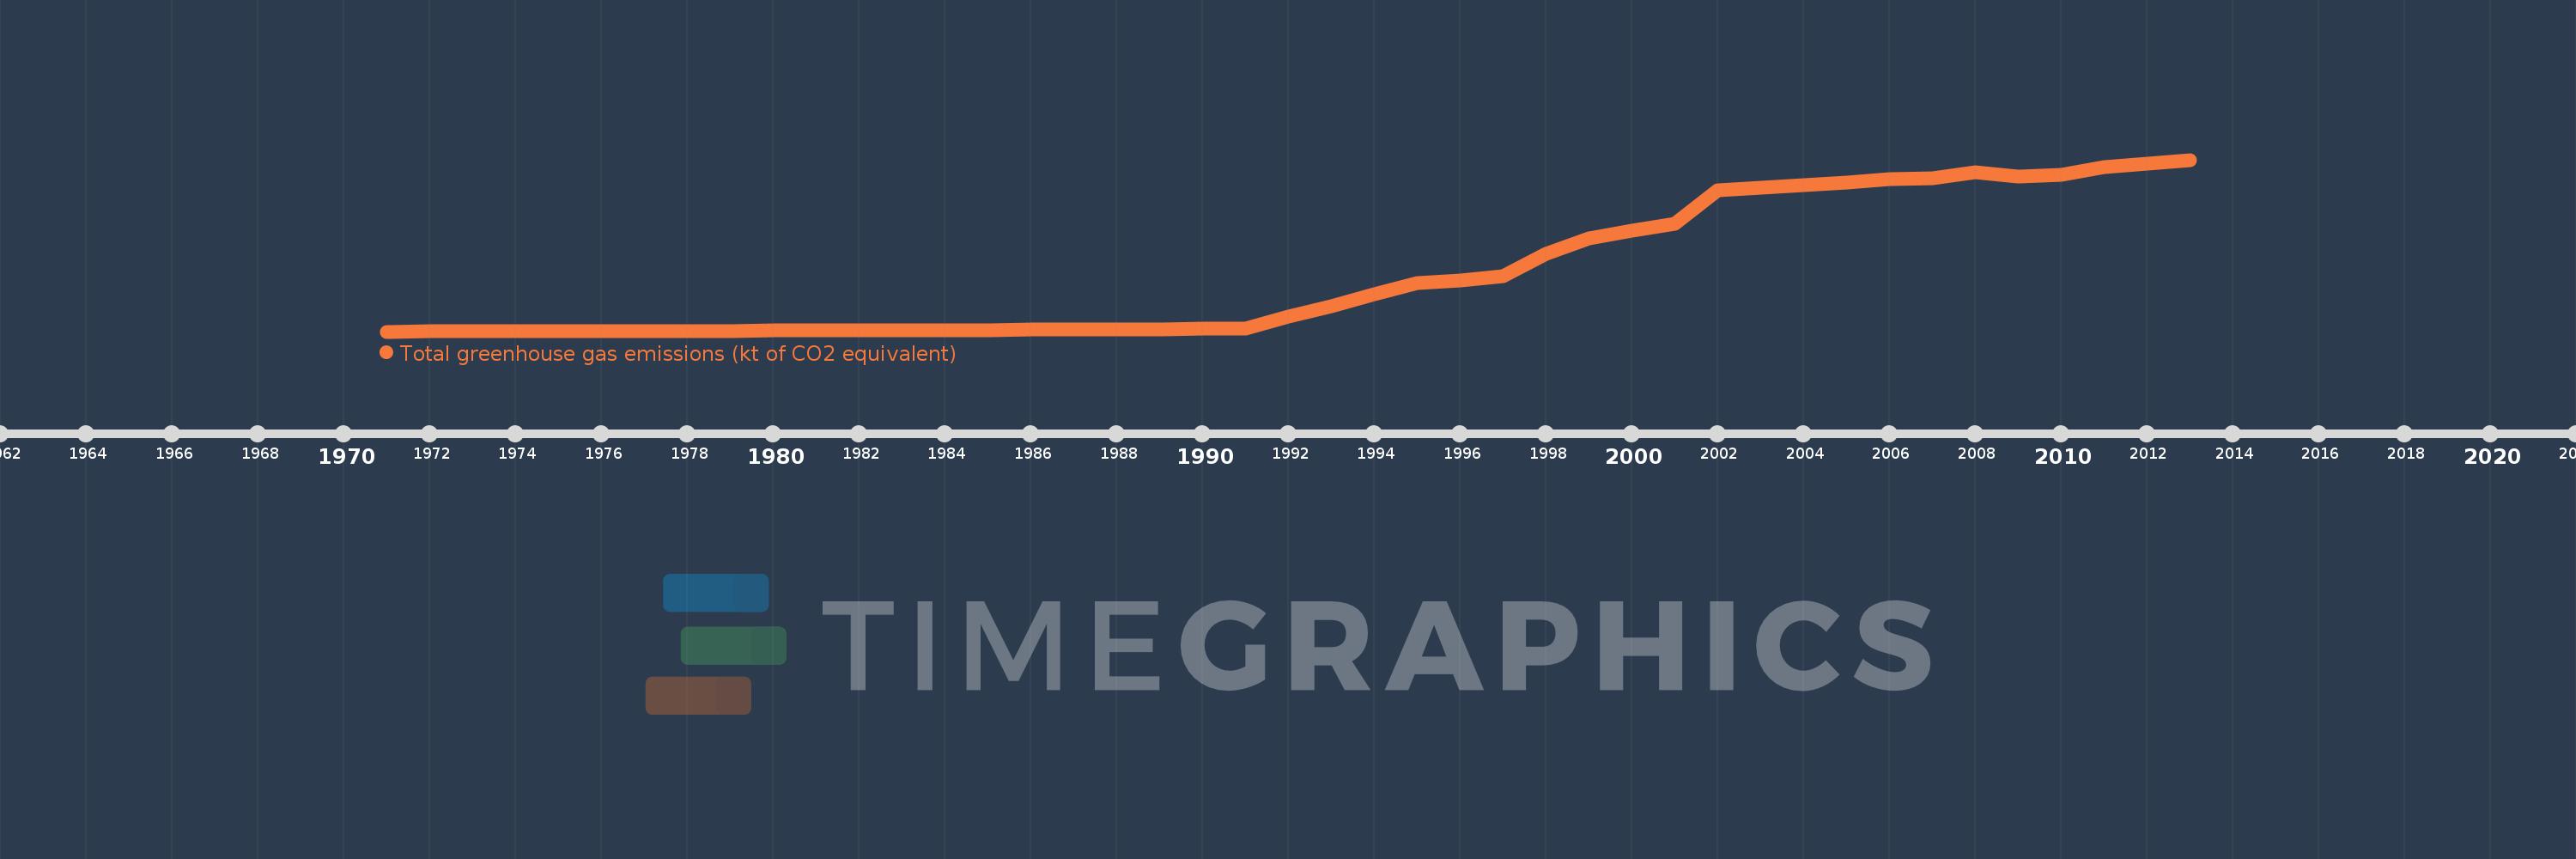
Total greenhouse gas emissions (kt of CO2 equivalent)
2013,2011,2010,2009,2008,2007,2006,2005,2002,2001,2000,1999,1998,1997,1996,1995,1994,1993,1992,1991,1990,1989,1988,1987,1986,1985,1984,1983,1982,1981,1980,1979,1978,1977,1976,1975,1974,1973,1972,1971
This statistics in other country:
AfghanistanAlbaniaAlgeriaAmerican SamoaAngolaAntigua and BarbudaArab WorldArgentinaArmeniaArubaAustraliaAustriaAzerbaijanBahamas, TheBahrainBangladeshBarbadosBelarusBelgiumBelizeBeninBermudaBhutanBoliviaBosnia and HerzegovinaBotswanaBrazilBritish Virgin IslandsBrunei DarussalamBulgariaBurkina FasoBurundiCabo VerdeCambodiaCameroonCanadaCaribbean small statesCayman IslandsCentral African RepublicCentral Europe and the BalticsChadChileChinaColombiaComorosCongo, Dem. Rep.Congo, Rep.Costa RicaCote d'IvoireCroatiaCubaCyprusCzech RepublicDenmarkDjiboutiDominicaDominican RepublicEarly-demographic dividendEast Asia & PacificEast Asia & Pacific (excluding high income)East Asia & Pacific (IDA & IBRD countries)EcuadorEgypt, Arab Rep.El SalvadorEquatorial GuineaEritreaEstoniaEthiopiaEuro areaEurope & Central AsiaEurope & Central Asia (excluding high income)Europe & Central Asia (IDA & IBRD countries)European UnionFijiFinlandFragile and conflict affected situationsFranceFrench PolynesiaGabonGambia, TheGeorgiaGermanyGhanaGibraltarGreeceGrenadaGuamGuatemalaGuineaGuinea-BissauGuyanaHaitiHeavily indebted poor countries (HIPC)High incomeHondurasHong Kong SAR, ChinaHungaryIBRD onlyIcelandIDA & IBRD totalIDA blendIDA onlyIDA totalIndiaIndonesiaIran, Islamic Rep.IraqIrelandIsraelItalyJamaicaJapanJordanKazakhstanKenyaKiribatiKorea, Dem. People’s Rep.Korea, Rep.KuwaitKyrgyz RepublicLao PDRLate-demographic dividendLatin America & Caribbean Latin America & Caribbean (excluding high income)Latin America & the Caribbean (IDA & IBRD countries)LatviaLeast developed countries: UN classificationLebanonLesothoLiberiaLibyaLithuaniaLow & middle incomeLow incomeLower middle incomeLuxembourgMacao SAR, ChinaMacedonia, FYRMadagascarMalawiMalaysiaMaldivesMaliMaltaMarshall IslandsMauritaniaMauritiusMexicoMicronesia, Fed. Sts.Middle East & North AfricaMiddle East & North Africa (excluding high income)Middle East & North Africa (IDA & IBRD countries)Middle incomeMoldovaMongoliaMoroccoMozambiqueMyanmarNamibiaNepalNetherlandsNew CaledoniaNew ZealandNicaraguaNigerNigeriaNorth AmericaNorthern Mariana IslandsNorwayOECD membersOmanOther small statesPacific island small statesPakistanPanamaPapua New GuineaParaguayPeruPhilippinesPolandPortugalPost-demographic dividendPre-demographic dividendPuerto RicoQatarRomaniaRussian FederationRwandaSamoaSao Tome and PrincipeSaudi ArabiaSenegalSeychellesSierra LeoneSingaporeSlovak RepublicSloveniaSmall statesSolomon IslandsSomaliaSouth AfricaSouth AsiaSouth Asia (IDA & IBRD)SpainSri LankaSt. Kitts and NevisSt. LuciaSt. Vincent and the GrenadinesSub-Saharan Africa Sub-Saharan Africa (excluding high income)Sub-Saharan Africa (IDA & IBRD countries)SudanSurinameSwazilandSwedenSwitzerlandSyrian Arab RepublicTajikistanTanzaniaThailandTimor-LesteTogoTongaTrinidad and TobagoTunisiaTurkeyTurkmenistanTurks and Caicos IslandsTuvaluUgandaUkraineUnited Arab EmiratesUnited KingdomUnited StatesUpper middle incomeUruguayUzbekistanVanuatuVenezuela, RBVietnamVirgin Islands (U.S.)WorldYemen, Rep.ZambiaZimbabwe Timeline:
This timeline shows a graph from 1971 to 2013 of Equatorial Guinea. No data until 1970. Number of actual observations by date: 40.
Source name:
World Development Indicators
Source organization:
European Commission, Joint Research Centre (JRC)/Netherlands Environmental Assessment Agency (PBL). Emission Database for Global Atmospheric Research (EDGAR), EDGARv4.2 FT2012: http://edgar.jrc.ec.europa.eu/
Categories, topics:
Climate Change, Environment
Last updated:
apr 23, 2017
Indicators value changes by year
Minimum:
120.086
jan 1, 1971
Maximum:
6.374K
jan 1, 2013
At the date of observation
Value
Absolute change
Change from previous value
jan 1, 1971
120.086
+120.086
0.0%
jan 1, 1972
121.623
+1.536
1.28%
jan 1, 1973
123.94
+2.317
1.9%
jan 1, 1974
128.145
+4.205
3.39%
jan 1, 1975
131.226
+3.081
2.4%
jan 1, 1976
135.176
+3.95
3.01%
jan 1, 1977
138.388
+3.212
2.38%
jan 1, 1978
144.878
+6.49
4.69%
jan 1, 1979
146.642
+1.764
1.22%
jan 1, 1980
156.55
+9.909
6.76%
jan 1, 1981
158.313
+1.763
1.13%
jan 1, 1982
156.859
-1.454
-0.92%
jan 1, 1983
173.094
+16.235
10.35%
jan 1, 1984
178.146
+5.052
2.92%
jan 1, 1985
180.291
+2.145
1.2%
jan 1, 1986
191.803
+11.512
6.39%
jan 1, 1987
198.724
+6.921
3.61%
jan 1, 1988
201.099
+2.376
1.2%
jan 1, 1989
205.716
+4.617
2.3%
jan 1, 1990
240.832
+35.116
17.07%
jan 1, 1991
243.38
+2.548
1.06%
jan 1, 1992
656.364
+412.983
169.69%
jan 1, 1993
1.057K
+400.676
61.04%
jan 1, 1994
1.476K
+419.2
39.66%
jan 1, 1995
1.878K
+401.804
27.22%
jan 1, 1996
1.992K
+113.948
6.07%
jan 1, 1997
2.147K
+154.826
7.77%
jan 1, 1998
2.937K
+790.395
36.82%
jan 1, 1999
3.525K
+587.787
20.01%
jan 1, 2000
3.783K
+257.64
7.31%
jan 1, 2001
4.048K
+265.69
7.02%
jan 1, 2002
5.278K
+1.23K
30.37%
jan 1, 2005
5.554K
+275.982
5.23%
jan 1, 2006
5.676K
+121.91
2.2%
jan 1, 2007
5.693K
+17.252
0.3%
jan 1, 2008
5.927K
+233.998
4.11%
jan 1, 2009
5.766K
-160.769
-2.71%
jan 1, 2010
5.841K
+74.152
1.29%
jan 1, 2011
6.099K
+258.592
4.43%
jan 1, 2013
6.374K
+275.057
4.51%
Ranking of countries by current statistics by years


Comments: