29
/
en
AIzaSyAYiBZKx7MnpbEhh9jyipgxe19OcubqV5w
April 1, 2024
255913
Swaziland
SWZ
true
2
1
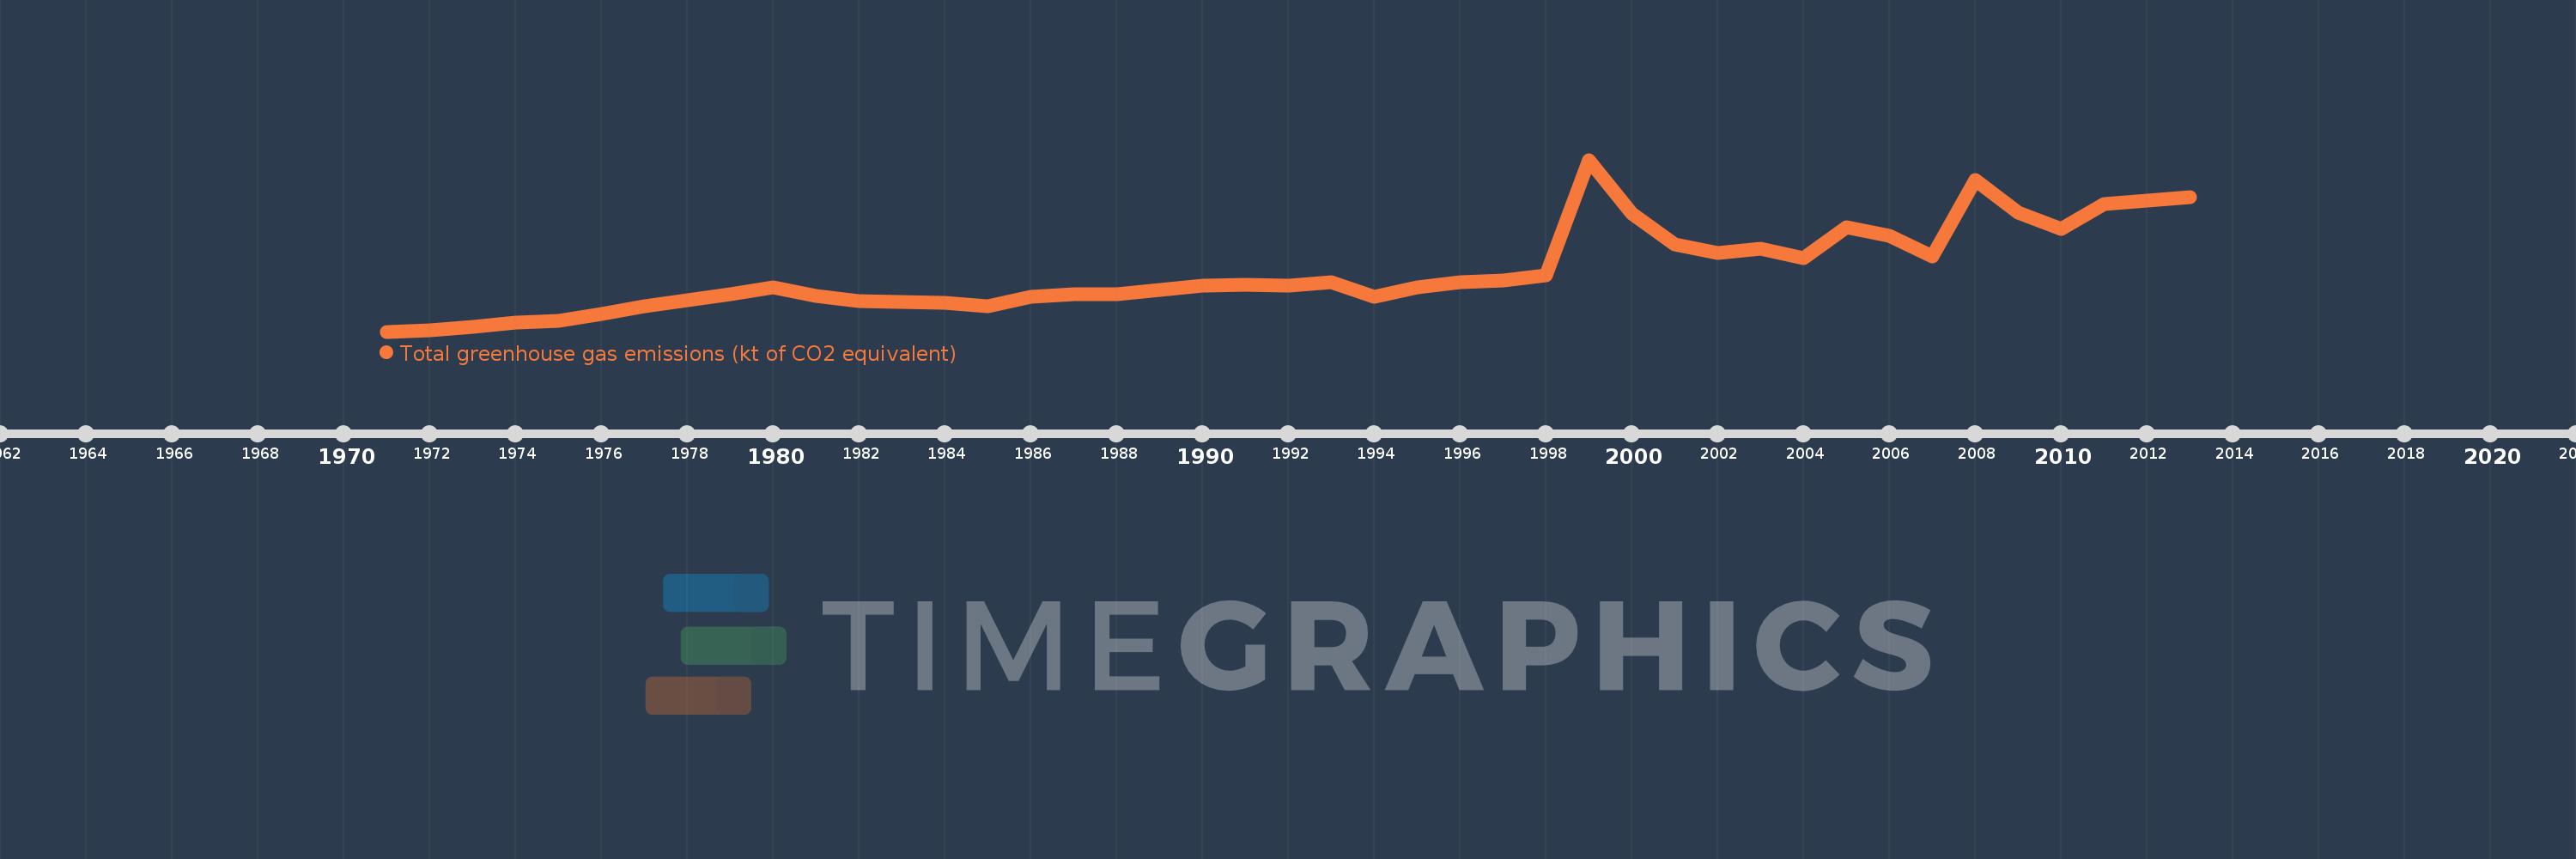
Total greenhouse gas emissions (kt of CO2 equivalent)
2013,2012,2011,2010,2009,2008,2007,2006,2005,2004,2003,2002,2001,2000,1999,1998,1997,1996,1995,1994,1993,1992,1991,1990,1989,1988,1987,1986,1985,1984,1983,1982,1981,1980,1979,1978,1977,1976,1975,1974,1973,1972,1971
This statistics in other country:
AfghanistanAlbaniaAlgeriaAmerican SamoaAngolaAntigua and BarbudaArab WorldArgentinaArmeniaArubaAustraliaAustriaAzerbaijanBahamas, TheBahrainBangladeshBarbadosBelarusBelgiumBelizeBeninBermudaBhutanBoliviaBosnia and HerzegovinaBotswanaBrazilBritish Virgin IslandsBrunei DarussalamBulgariaBurkina FasoBurundiCabo VerdeCambodiaCameroonCanadaCaribbean small statesCayman IslandsCentral African RepublicCentral Europe and the BalticsChadChileChinaColombiaComorosCongo, Dem. Rep.Congo, Rep.Costa RicaCote d'IvoireCroatiaCubaCyprusCzech RepublicDenmarkDjiboutiDominicaDominican RepublicEarly-demographic dividendEast Asia & PacificEast Asia & Pacific (excluding high income)East Asia & Pacific (IDA & IBRD countries)EcuadorEgypt, Arab Rep.El SalvadorEquatorial GuineaEritreaEstoniaEthiopiaEuro areaEurope & Central AsiaEurope & Central Asia (excluding high income)Europe & Central Asia (IDA & IBRD countries)European UnionFijiFinlandFragile and conflict affected situationsFranceFrench PolynesiaGabonGambia, TheGeorgiaGermanyGhanaGibraltarGreeceGrenadaGuamGuatemalaGuineaGuinea-BissauGuyanaHaitiHeavily indebted poor countries (HIPC)High incomeHondurasHong Kong SAR, ChinaHungaryIBRD onlyIcelandIDA & IBRD totalIDA blendIDA onlyIDA totalIndiaIndonesiaIran, Islamic Rep.IraqIrelandIsraelItalyJamaicaJapanJordanKazakhstanKenyaKiribatiKorea, Dem. People’s Rep.Korea, Rep.KuwaitKyrgyz RepublicLao PDRLate-demographic dividendLatin America & Caribbean Latin America & Caribbean (excluding high income)Latin America & the Caribbean (IDA & IBRD countries)LatviaLeast developed countries: UN classificationLebanonLesothoLiberiaLibyaLithuaniaLow & middle incomeLow incomeLower middle incomeLuxembourgMacao SAR, ChinaMacedonia, FYRMadagascarMalawiMalaysiaMaldivesMaliMaltaMarshall IslandsMauritaniaMauritiusMexicoMicronesia, Fed. Sts.Middle East & North AfricaMiddle East & North Africa (excluding high income)Middle East & North Africa (IDA & IBRD countries)Middle incomeMoldovaMongoliaMoroccoMozambiqueMyanmarNamibiaNepalNetherlandsNew CaledoniaNew ZealandNicaraguaNigerNigeriaNorth AmericaNorthern Mariana IslandsNorwayOECD membersOmanOther small statesPacific island small statesPakistanPanamaPapua New GuineaParaguayPeruPhilippinesPolandPortugalPost-demographic dividendPre-demographic dividendPuerto RicoQatarRomaniaRussian FederationRwandaSamoaSao Tome and PrincipeSaudi ArabiaSenegalSeychellesSierra LeoneSingaporeSlovak RepublicSloveniaSmall statesSolomon IslandsSomaliaSouth AfricaSouth AsiaSouth Asia (IDA & IBRD)SpainSri LankaSt. Kitts and NevisSt. LuciaSt. Vincent and the GrenadinesSub-Saharan Africa Sub-Saharan Africa (excluding high income)Sub-Saharan Africa (IDA & IBRD countries)SudanSurinameSwazilandSwedenSwitzerlandSyrian Arab RepublicTajikistanTanzaniaThailandTimor-LesteTogoTongaTrinidad and TobagoTunisiaTurkeyTurkmenistanTurks and Caicos IslandsTuvaluUgandaUkraineUnited Arab EmiratesUnited KingdomUnited StatesUpper middle incomeUruguayUzbekistanVanuatuVenezuela, RBVietnamVirgin Islands (U.S.)WorldYemen, Rep.ZambiaZimbabwe Timeline:
This timeline shows a graph from 1971 to 2013 of Swaziland. No data until 1970. Number of actual observations by date: 43.
Source name:
World Development Indicators
Source organization:
European Commission, Joint Research Centre (JRC)/Netherlands Environmental Assessment Agency (PBL). Emission Database for Global Atmospheric Research (EDGAR), EDGARv4.2 FT2012: http://edgar.jrc.ec.europa.eu/
Categories, topics:
Climate Change, Environment
Last updated:
apr 23, 2017
Indicators value changes by year
Minimum:
1.607K
jan 1, 1971
Maximum:
3.994K
jan 1, 1999
At the date of observation
Value
Absolute change
Change from previous value
jan 1, 1971
1.607K
+1.607K
0.0%
jan 1, 1972
1.627K
+19.415
1.21%
jan 1, 1973
1.669K
+42.39
2.61%
jan 1, 1974
1.738K
+68.922
4.13%
jan 1, 1975
1.753K
+14.937
0.86%
jan 1, 1976
1.849K
+95.817
5.47%
jan 1, 1977
1.965K
+116.167
6.28%
jan 1, 1978
2.045K
+80.334
4.09%
jan 1, 1979
2.132K
+87.108
4.26%
jan 1, 1980
2.226K
+93.836
4.4%
jan 1, 1981
2.101K
-125.483
-5.64%
jan 1, 1982
2.032K
-68.638
-3.27%
jan 1, 1983
2.024K
-8.015
-0.39%
jan 1, 1984
2.006K
-18.101
-0.89%
jan 1, 1985
1.962K
-44.34
-2.21%
jan 1, 1986
2.095K
+133.68
6.82%
jan 1, 1987
2.122K
+26.76
1.28%
jan 1, 1988
2.126K
+4.109
0.19%
jan 1, 1989
2.19K
+63.675
2.99%
jan 1, 1990
2.25K
+60.5
2.76%
jan 1, 1991
2.262K
+11.38
0.51%
jan 1, 1992
2.25K
-11.864
-0.52%
jan 1, 1993
2.289K
+38.905
1.73%
jan 1, 1994
2.093K
-196.091
-8.57%
jan 1, 1995
2.219K
+126.004
6.02%
jan 1, 1996
2.293K
+73.969
3.33%
jan 1, 1997
2.314K
+21.639
0.94%
jan 1, 1998
2.385K
+71.057
3.07%
jan 1, 1999
3.994K
+1.609K
67.47%
jan 1, 2000
3.252K
-742.602
-18.59%
jan 1, 2001
2.815K
-437.119
-13.44%
jan 1, 2002
2.695K
-119.746
-4.25%
jan 1, 2003
2.761K
+65.56
2.43%
jan 1, 2004
2.632K
-128.183
-4.64%
jan 1, 2005
3.059K
+426.264
16.19%
jan 1, 2006
2.94K
-118.218
-3.87%
jan 1, 2007
2.647K
-293.678
-9.99%
jan 1, 2008
3.715K
+1.069K
40.37%
jan 1, 2009
3.256K
-459.423
-12.37%
jan 1, 2010
3.032K
-223.35
-6.86%
jan 1, 2011
3.378K
+345.847
11.4%
jan 1, 2012
3.43K
+51.686
1.53%
jan 1, 2013
3.478K
+48.01
1.4%
Ranking of countries by current statistics by years


Comments: