29
/
en
AIzaSyAYiBZKx7MnpbEhh9jyipgxe19OcubqV5w
April 1, 2024
83564
Belize
BLZ
true
2
1
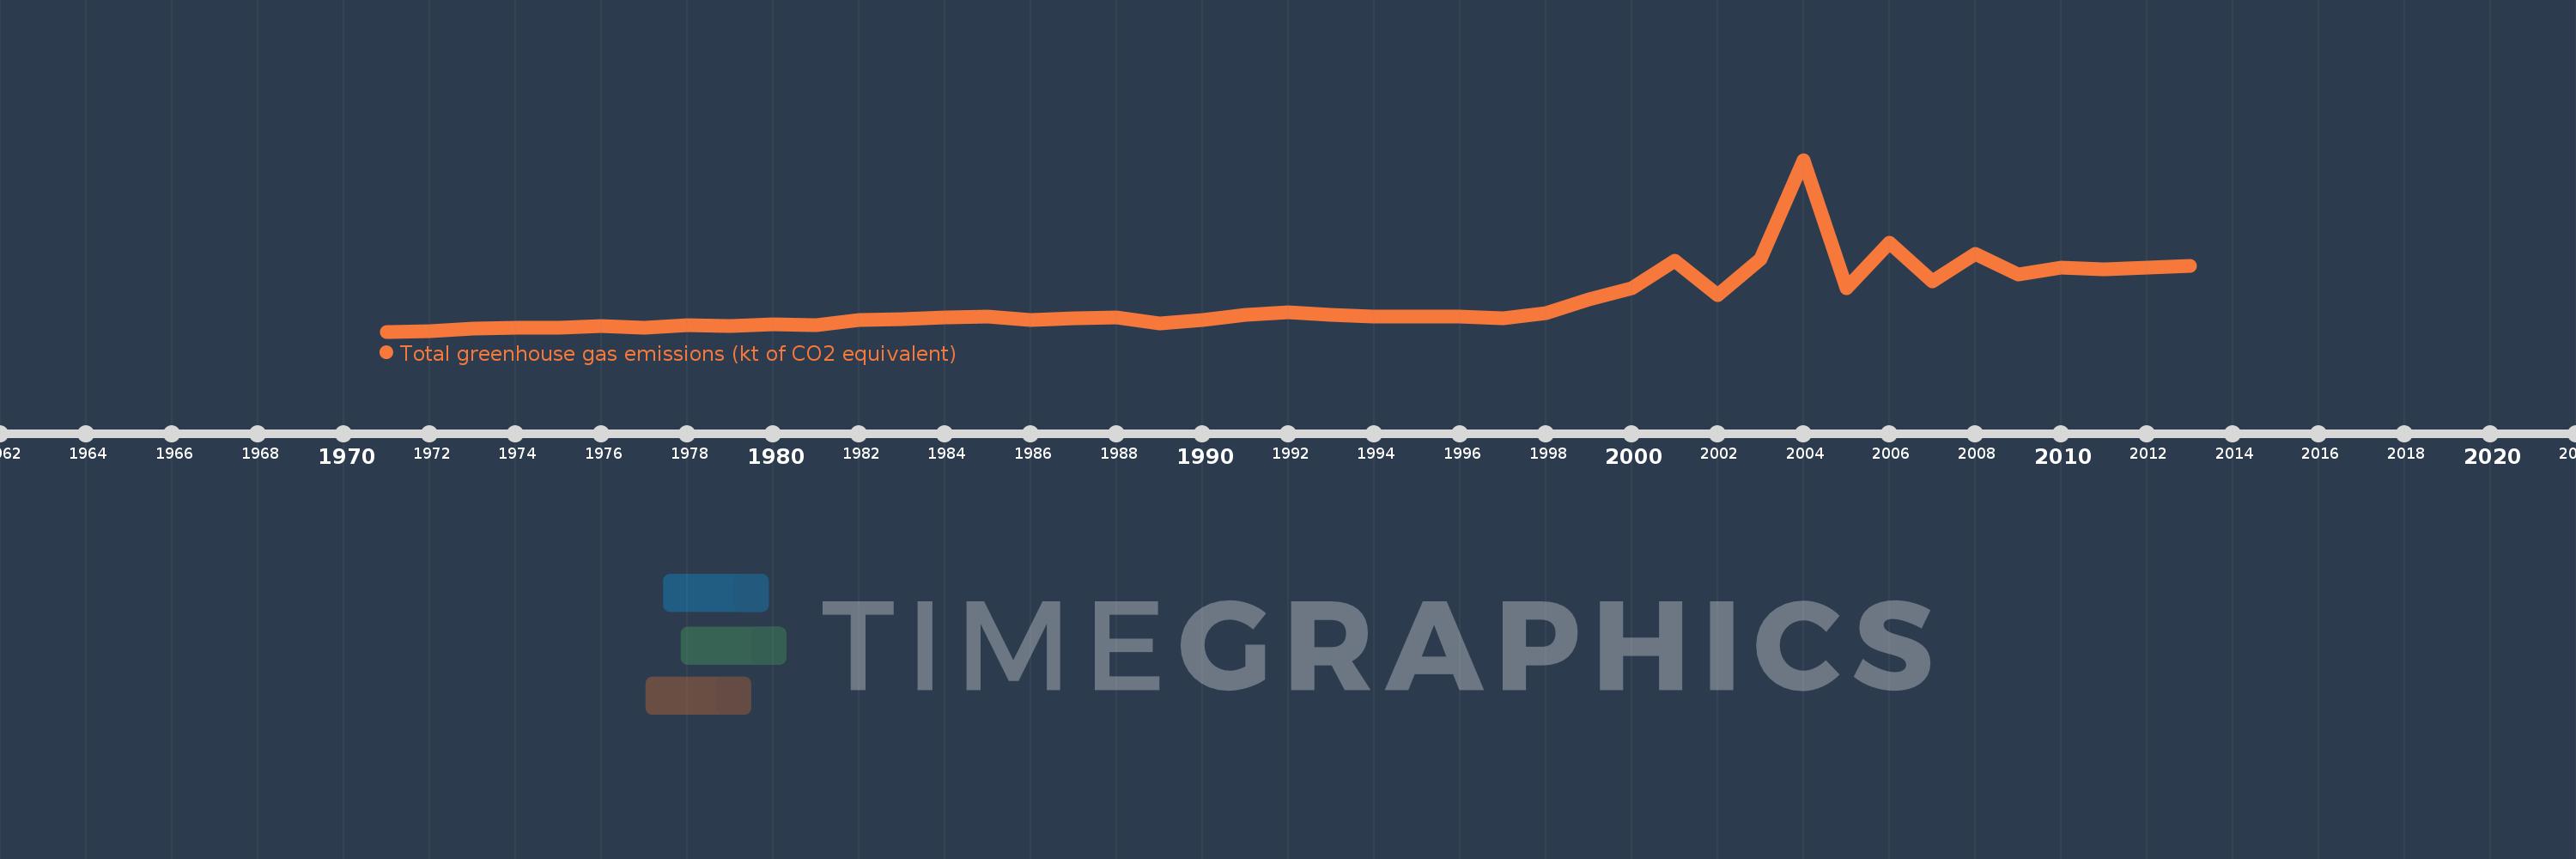
Total greenhouse gas emissions (kt of CO2 equivalent)
2013,2012,2011,2010,2009,2008,2007,2006,2005,2004,2003,2002,2001,2000,1999,1998,1997,1996,1995,1994,1993,1992,1991,1990,1989,1988,1987,1986,1985,1984,1983,1982,1981,1980,1979,1978,1977,1976,1975,1974,1973,1972,1971
This statistics in other country:
AfghanistanAlbaniaAlgeriaAmerican SamoaAngolaAntigua and BarbudaArab WorldArgentinaArmeniaArubaAustraliaAustriaAzerbaijanBahamas, TheBahrainBangladeshBarbadosBelarusBelgiumBelizeBeninBermudaBhutanBoliviaBosnia and HerzegovinaBotswanaBrazilBritish Virgin IslandsBrunei DarussalamBulgariaBurkina FasoBurundiCabo VerdeCambodiaCameroonCanadaCaribbean small statesCayman IslandsCentral African RepublicCentral Europe and the BalticsChadChileChinaColombiaComorosCongo, Dem. Rep.Congo, Rep.Costa RicaCote d'IvoireCroatiaCubaCyprusCzech RepublicDenmarkDjiboutiDominicaDominican RepublicEarly-demographic dividendEast Asia & PacificEast Asia & Pacific (excluding high income)East Asia & Pacific (IDA & IBRD countries)EcuadorEgypt, Arab Rep.El SalvadorEquatorial GuineaEritreaEstoniaEthiopiaEuro areaEurope & Central AsiaEurope & Central Asia (excluding high income)Europe & Central Asia (IDA & IBRD countries)European UnionFijiFinlandFragile and conflict affected situationsFranceFrench PolynesiaGabonGambia, TheGeorgiaGermanyGhanaGibraltarGreeceGrenadaGuamGuatemalaGuineaGuinea-BissauGuyanaHaitiHeavily indebted poor countries (HIPC)High incomeHondurasHong Kong SAR, ChinaHungaryIBRD onlyIcelandIDA & IBRD totalIDA blendIDA onlyIDA totalIndiaIndonesiaIran, Islamic Rep.IraqIrelandIsraelItalyJamaicaJapanJordanKazakhstanKenyaKiribatiKorea, Dem. People’s Rep.Korea, Rep.KuwaitKyrgyz RepublicLao PDRLate-demographic dividendLatin America & Caribbean Latin America & Caribbean (excluding high income)Latin America & the Caribbean (IDA & IBRD countries)LatviaLeast developed countries: UN classificationLebanonLesothoLiberiaLibyaLithuaniaLow & middle incomeLow incomeLower middle incomeLuxembourgMacao SAR, ChinaMacedonia, FYRMadagascarMalawiMalaysiaMaldivesMaliMaltaMarshall IslandsMauritaniaMauritiusMexicoMicronesia, Fed. Sts.Middle East & North AfricaMiddle East & North Africa (excluding high income)Middle East & North Africa (IDA & IBRD countries)Middle incomeMoldovaMongoliaMoroccoMozambiqueMyanmarNamibiaNepalNetherlandsNew CaledoniaNew ZealandNicaraguaNigerNigeriaNorth AmericaNorthern Mariana IslandsNorwayOECD membersOmanOther small statesPacific island small statesPakistanPanamaPapua New GuineaParaguayPeruPhilippinesPolandPortugalPost-demographic dividendPre-demographic dividendPuerto RicoQatarRomaniaRussian FederationRwandaSamoaSao Tome and PrincipeSaudi ArabiaSenegalSeychellesSierra LeoneSingaporeSlovak RepublicSloveniaSmall statesSolomon IslandsSomaliaSouth AfricaSouth AsiaSouth Asia (IDA & IBRD)SpainSri LankaSt. Kitts and NevisSt. LuciaSt. Vincent and the GrenadinesSub-Saharan Africa Sub-Saharan Africa (excluding high income)Sub-Saharan Africa (IDA & IBRD countries)SudanSurinameSwazilandSwedenSwitzerlandSyrian Arab RepublicTajikistanTanzaniaThailandTimor-LesteTogoTongaTrinidad and TobagoTunisiaTurkeyTurkmenistanTurks and Caicos IslandsTuvaluUgandaUkraineUnited Arab EmiratesUnited KingdomUnited StatesUpper middle incomeUruguayUzbekistanVanuatuVenezuela, RBVietnamVirgin Islands (U.S.)WorldYemen, Rep.ZambiaZimbabwe Timeline:
This timeline shows a graph from 1971 to 2013 of Belize. No data until 1970. Number of actual observations by date: 43.
Source name:
World Development Indicators
Source organization:
European Commission, Joint Research Centre (JRC)/Netherlands Environmental Assessment Agency (PBL). Emission Database for Global Atmospheric Research (EDGAR), EDGARv4.2 FT2012: http://edgar.jrc.ec.europa.eu/
Categories, topics:
Climate Change, Environment
Last updated:
apr 23, 2017
Indicators value changes by year
Minimum:
312.981
jan 1, 1971
Maximum:
3.604K
jan 1, 2004
At the date of observation
Value
Absolute change
Change from previous value
jan 1, 1971
312.981
+312.981
0.0%
jan 1, 1972
324.5
+11.519
3.68%
jan 1, 1973
364.983
+40.483
12.48%
jan 1, 1974
395.053
+30.07
8.24%
jan 1, 1975
391.125
-3.928
-0.99%
jan 1, 1976
423.765
+32.64
8.35%
jan 1, 1977
391.305
-32.46
-7.66%
jan 1, 1978
430.655
+39.349
10.06%
jan 1, 1979
423.977
-6.678
-1.55%
jan 1, 1980
452.739
+28.762
6.78%
jan 1, 1981
440.92
-11.82
-2.61%
jan 1, 1982
531.041
+90.122
20.44%
jan 1, 1983
557.548
+26.507
4.99%
jan 1, 1984
579.4
+21.851
3.92%
jan 1, 1985
603.2
+23.8
4.11%
jan 1, 1986
527.223
-75.976
-12.6%
jan 1, 1987
572.173
+44.95
8.53%
jan 1, 1988
592.22
+20.047
3.5%
jan 1, 1989
475.735
-116.485
-19.67%
jan 1, 1990
534.713
+58.978
12.4%
jan 1, 1991
632.716
+98.003
18.33%
jan 1, 1992
690.124
+57.407
9.07%
jan 1, 1993
632.685
-57.438
-8.32%
jan 1, 1994
608.19
-24.495
-3.87%
jan 1, 1995
592.854
-15.336
-2.52%
jan 1, 1996
602.929
+10.075
1.7%
jan 1, 1997
573.963
-28.966
-4.8%
jan 1, 1998
662.671
+88.708
15.46%
jan 1, 1999
923.136
+260.464
39.31%
jan 1, 2000
1.144K
+220.541
23.89%
jan 1, 2001
1.676K
+532.794
46.59%
jan 1, 2002
1.013K
-662.988
-39.55%
jan 1, 2003
1.703K
+689.102
67.99%
jan 1, 2004
3.604K
+1.902K
111.7%
jan 1, 2005
1.146K
-2.458K
-68.2%
jan 1, 2006
2.022K
+876.096
76.44%
jan 1, 2007
1.277K
-745.627
-36.87%
jan 1, 2008
1.802K
+525.605
41.17%
jan 1, 2009
1.408K
-394.014
-21.86%
jan 1, 2010
1.534K
+126.216
8.96%
jan 1, 2011
1.499K
-35.486
-2.31%
jan 1, 2012
1.536K
+37.359
2.49%
jan 1, 2013
1.57K
+33.621
2.19%
Ranking of countries by current statistics by years


Comments: