29
/
en
AIzaSyAYiBZKx7MnpbEhh9jyipgxe19OcubqV5w
April 1, 2024
82876
Belize
BLZ
true
2
1
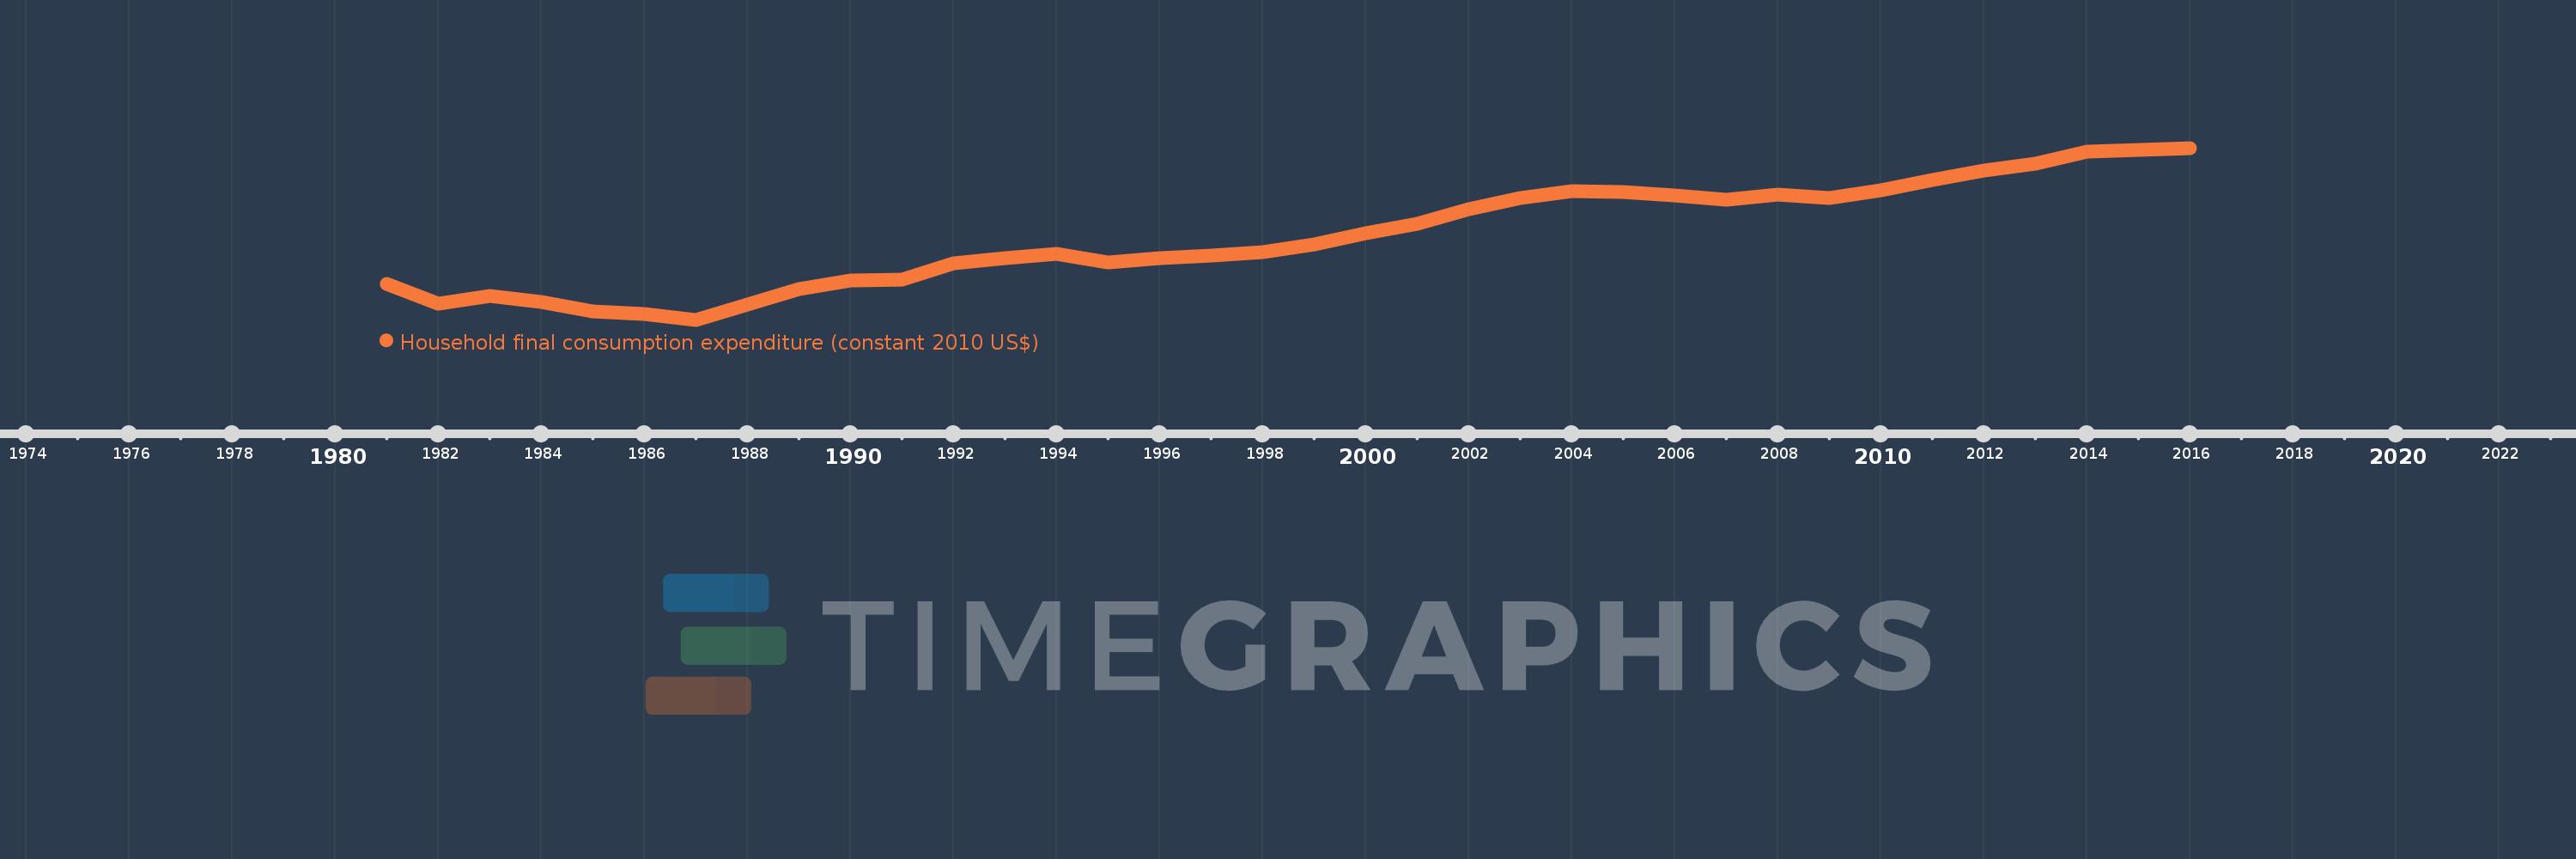
Household final consumption expenditure (constant 2010 US$)
2016,2015,2014,2013,2012,2011,2010,2009,2008,2007,2006,2005,2004,2003,2002,2001,2000,1999,1998,1997,1996,1995,1994,1993,1992,1991,1990,1989,1988,1987,1986,1985,1984,1983,1982,1981
This statistics in other country:
AfghanistanAlbaniaAlgeriaAngolaAntigua and BarbudaArab WorldArgentinaArmeniaArubaAustraliaAustriaAzerbaijanBahamas, TheBahrainBangladeshBarbadosBelarusBelgiumBelizeBeninBermudaBhutanBoliviaBosnia and HerzegovinaBotswanaBrazilBrunei DarussalamBulgariaBurkina FasoBurundiCabo VerdeCambodiaCameroonCanadaCaribbean small statesCentral African RepublicCentral Europe and the BalticsChadChileChinaColombiaComorosCongo, Dem. Rep.Congo, Rep.Costa RicaCote d'IvoireCroatiaCubaCyprusCzech RepublicDenmarkDominicaDominican RepublicEarly-demographic dividendEast Asia & PacificEast Asia & Pacific (excluding high income)East Asia & Pacific (IDA & IBRD countries)EcuadorEgypt, Arab Rep.El SalvadorEquatorial GuineaEritreaEstoniaEuro areaEurope & Central AsiaEurope & Central Asia (excluding high income)Europe & Central Asia (IDA & IBRD countries)European UnionFaroe IslandsFinlandFranceGabonGambia, TheGeorgiaGermanyGhanaGreeceGrenadaGuatemalaGuineaGuinea-BissauGuyanaHaitiHeavily indebted poor countries (HIPC)High incomeHondurasHong Kong SAR, ChinaHungaryIBRD onlyIcelandIDA & IBRD totalIDA blendIDA onlyIDA totalIndiaIndonesiaIran, Islamic Rep.IrelandIsraelItalyJamaicaJapanJordanKazakhstanKenyaKorea, Rep.KosovoKuwaitKyrgyz RepublicLao PDRLate-demographic dividendLatin America & Caribbean Latin America & Caribbean (excluding high income)Latin America & the Caribbean (IDA & IBRD countries)LatviaLeast developed countries: UN classificationLebanonLiberiaLithuaniaLow & middle incomeLow incomeLower middle incomeLuxembourgMacao SAR, ChinaMacedonia, FYRMadagascarMalawiMalaysiaMaliMaltaMauritaniaMauritiusMexicoMiddle East & North AfricaMiddle East & North Africa (excluding high income)Middle East & North Africa (IDA & IBRD countries)Middle incomeMoldovaMongoliaMontenegroMoroccoMozambiqueNamibiaNepalNetherlandsNew ZealandNicaraguaNigerNigeriaNorth AmericaNorwayOECD membersOmanOther small statesPakistanPanamaParaguayPeruPhilippinesPolandPortugalPost-demographic dividendPre-demographic dividendPuerto RicoQatarRomaniaRussian FederationRwandaSaudi ArabiaSenegalSerbiaSeychellesSierra LeoneSingaporeSlovak RepublicSloveniaSmall statesSouth AfricaSouth AsiaSouth Asia (IDA & IBRD)South SudanSpainSri LankaSt. Kitts and NevisSt. LuciaSt. Vincent and the GrenadinesSub-Saharan Africa Sub-Saharan Africa (excluding high income)Sub-Saharan Africa (IDA & IBRD countries)SudanSurinameSwazilandSwedenSwitzerlandTajikistanTanzaniaThailandTimor-LesteTogoTongaTrinidad and TobagoTunisiaTurkeyTurkmenistanUgandaUkraineUnited Arab EmiratesUnited KingdomUnited StatesUpper middle incomeUruguayUzbekistanVanuatuVenezuela, RBVietnamWest Bank and GazaWorldYemen, Rep.ZambiaZimbabwe Timeline:
This timeline shows a graph from 1981 to 2016 of Belize. No data until 1980. Number of actual observations by date: 36.
Source name:
World Development Indicators
Source organization:
World Bank national accounts data, and OECD National Accounts data files.
Categories, topics:
Economy & Growth
Last updated:
apr 23, 2017
Indicators value changes by year
Minimum:
284.94 mln
jan 1, 1987
Maximum:
1.149 bln
jan 1, 2016
At the date of observation
Value
Absolute change
Change from previous value
jan 1, 1981
467.104 mln
+467.104 mln
0.0%
jan 1, 1982
366.728 mln
-100.376 mln
-21.49%
jan 1, 1983
406.663 mln
+39.935 mln
10.89%
jan 1, 1984
374.043 mln
-32.619 mln
-8.02%
jan 1, 1985
325.594 mln
-48.449 mln
-12.95%
jan 1, 1986
314.441 mln
-11.153 mln
-3.43%
jan 1, 1987
284.94 mln
-29.501 mln
-9.38%
jan 1, 1988
359.293 mln
+74.353 mln
26.09%
jan 1, 1989
438.083 mln
+78.79 mln
21.93%
jan 1, 1990
480.776 mln
+42.693 mln
9.75%
jan 1, 1991
485.453 mln
+4.677 mln
0.97%
jan 1, 1992
570.479 mln
+85.026 mln
17.51%
jan 1, 1993
593.504 mln
+23.025 mln
4.04%
jan 1, 1994
614.869 mln
+21.365 mln
3.6%
jan 1, 1995
573.972 mln
-40.897 mln
-6.65%
jan 1, 1996
595.41 mln
+21.438 mln
3.73%
jan 1, 1997
609.453 mln
+14.043 mln
2.36%
jan 1, 1998
623.559 mln
+14.105 mln
2.31%
jan 1, 1999
665.378 mln
+41.819 mln
6.71%
jan 1, 2000
721.861 mln
+56.484 mln
8.49%
jan 1, 2001
766.166 mln
+44.305 mln
6.14%
jan 1, 2002
840.484 mln
+74.317 mln
9.7%
jan 1, 2003
896.843 mln
+56.359 mln
6.71%
jan 1, 2004
929.999 mln
+33.156 mln
3.7%
jan 1, 2005
927.789 mln
-2.21 mln
-0.24%
jan 1, 2006
908.992 mln
-18.797 mln
-2.03%
jan 1, 2007
886.778 mln
-22.215 mln
-2.44%
jan 1, 2008
916.387 mln
+29.609 mln
3.34%
jan 1, 2009
898.938 mln
-17.449 mln
-1.9%
jan 1, 2010
936.631 mln
+37.693 mln
4.19%
jan 1, 2011
990.056 mln
+53.425 mln
5.7%
jan 1, 2012
1.036 bln
+46.115 mln
4.66%
jan 1, 2013
1.072 bln
+36.142 mln
3.49%
jan 1, 2014
1.13 bln
+57.993 mln
5.41%
jan 1, 2015
1.138 bln
+7.238 mln
0.64%
jan 1, 2016
1.149 bln
+11.881 mln
1.04%
Ranking of countries by current statistics by years


Comments: