29
/
en
AIzaSyAYiBZKx7MnpbEhh9jyipgxe19OcubqV5w
April 1, 2024
182171
Luxembourg
LUX
true
2
1
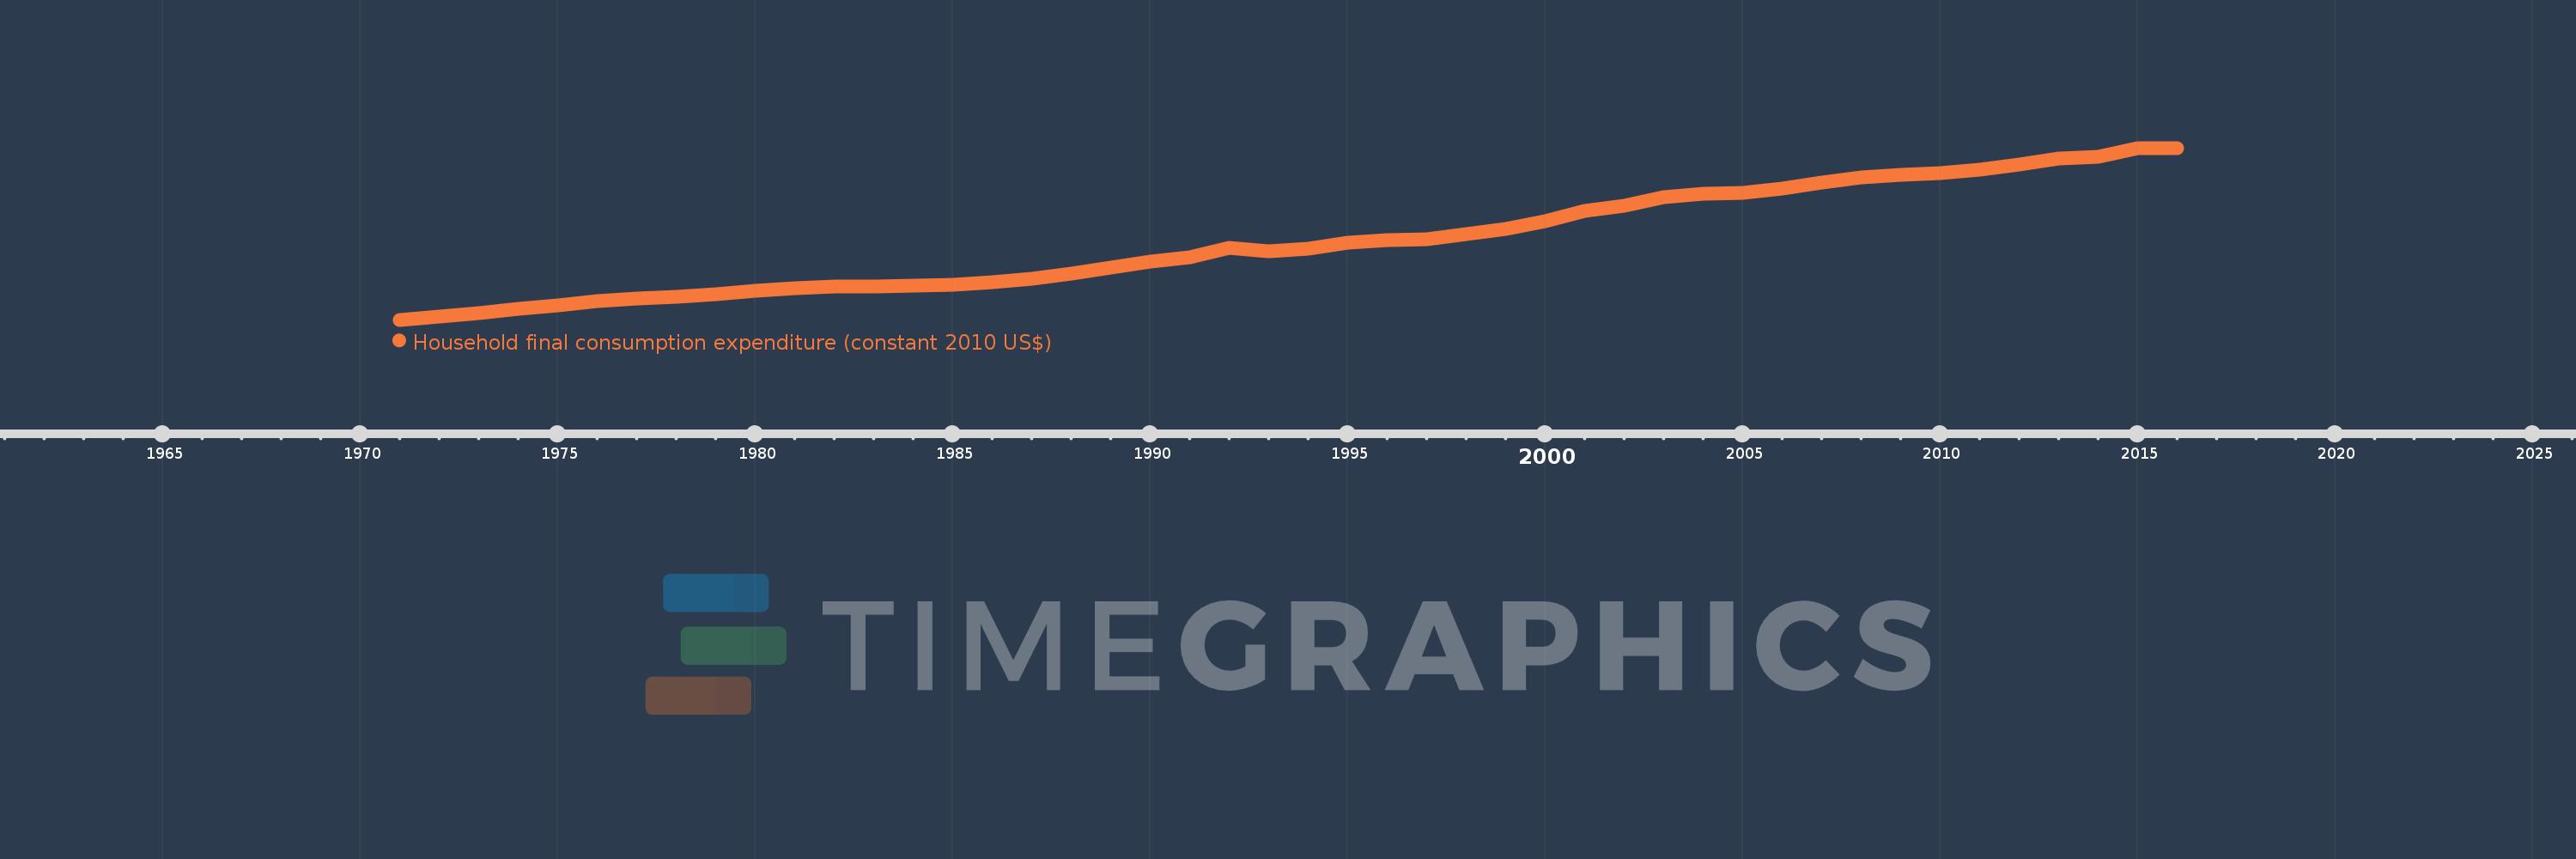
Household final consumption expenditure (constant 2010 US$)
2016,2015,2014,2013,2012,2011,2010,2009,2008,2007,2006,2005,2004,2003,2002,2001,2000,1999,1998,1997,1996,1995,1994,1993,1992,1991,1990,1989,1988,1987,1986,1985,1984,1983,1982,1981,1980,1979,1978,1977,1976,1975,1974,1973,1972,1971
This statistics in other country:
AfghanistanAlbaniaAlgeriaAngolaAntigua and BarbudaArab WorldArgentinaArmeniaArubaAustraliaAustriaAzerbaijanBahamas, TheBahrainBangladeshBarbadosBelarusBelgiumBelizeBeninBermudaBhutanBoliviaBosnia and HerzegovinaBotswanaBrazilBrunei DarussalamBulgariaBurkina FasoBurundiCabo VerdeCambodiaCameroonCanadaCaribbean small statesCentral African RepublicCentral Europe and the BalticsChadChileChinaColombiaComorosCongo, Dem. Rep.Congo, Rep.Costa RicaCote d'IvoireCroatiaCubaCyprusCzech RepublicDenmarkDominicaDominican RepublicEarly-demographic dividendEast Asia & PacificEast Asia & Pacific (excluding high income)East Asia & Pacific (IDA & IBRD countries)EcuadorEgypt, Arab Rep.El SalvadorEquatorial GuineaEritreaEstoniaEuro areaEurope & Central AsiaEurope & Central Asia (excluding high income)Europe & Central Asia (IDA & IBRD countries)European UnionFaroe IslandsFinlandFranceGabonGambia, TheGeorgiaGermanyGhanaGreeceGrenadaGuatemalaGuineaGuinea-BissauGuyanaHaitiHeavily indebted poor countries (HIPC)High incomeHondurasHong Kong SAR, ChinaHungaryIBRD onlyIcelandIDA & IBRD totalIDA blendIDA onlyIDA totalIndiaIndonesiaIran, Islamic Rep.IrelandIsraelItalyJamaicaJapanJordanKazakhstanKenyaKorea, Rep.KosovoKuwaitKyrgyz RepublicLao PDRLate-demographic dividendLatin America & Caribbean Latin America & Caribbean (excluding high income)Latin America & the Caribbean (IDA & IBRD countries)LatviaLeast developed countries: UN classificationLebanonLiberiaLithuaniaLow & middle incomeLow incomeLower middle incomeLuxembourgMacao SAR, ChinaMacedonia, FYRMadagascarMalawiMalaysiaMaliMaltaMauritaniaMauritiusMexicoMiddle East & North AfricaMiddle East & North Africa (excluding high income)Middle East & North Africa (IDA & IBRD countries)Middle incomeMoldovaMongoliaMontenegroMoroccoMozambiqueNamibiaNepalNetherlandsNew ZealandNicaraguaNigerNigeriaNorth AmericaNorwayOECD membersOmanOther small statesPakistanPanamaParaguayPeruPhilippinesPolandPortugalPost-demographic dividendPre-demographic dividendPuerto RicoQatarRomaniaRussian FederationRwandaSaudi ArabiaSenegalSerbiaSeychellesSierra LeoneSingaporeSlovak RepublicSloveniaSmall statesSouth AfricaSouth AsiaSouth Asia (IDA & IBRD)South SudanSpainSri LankaSt. Kitts and NevisSt. LuciaSt. Vincent and the GrenadinesSub-Saharan Africa Sub-Saharan Africa (excluding high income)Sub-Saharan Africa (IDA & IBRD countries)SudanSurinameSwazilandSwedenSwitzerlandTajikistanTanzaniaThailandTimor-LesteTogoTongaTrinidad and TobagoTunisiaTurkeyTurkmenistanUgandaUkraineUnited Arab EmiratesUnited KingdomUnited StatesUpper middle incomeUruguayUzbekistanVanuatuVenezuela, RBVietnamWest Bank and GazaWorldYemen, Rep.ZambiaZimbabwe Timeline:
This timeline shows a graph from 1971 to 2016 of Luxembourg. No data until 1970. Number of actual observations by date: 46.
Source name:
World Development Indicators
Source organization:
World Bank national accounts data, and OECD National Accounts data files.
Categories, topics:
Economy & Growth
Last updated:
apr 23, 2017
Indicators value changes by year
Minimum:
5.161 bln
jan 1, 1971
Maximum:
19.046 bln
jan 1, 2016
At the date of observation
Value
Absolute change
Change from previous value
jan 1, 1971
5.161 bln
+5.161 bln
0.0%
jan 1, 1972
5.451 bln
+290.002 mln
5.62%
jan 1, 1973
5.715 bln
+264.029 mln
4.84%
jan 1, 1974
6.044 bln
+328.928 mln
5.76%
jan 1, 1975
6.316 bln
+271.937 mln
4.5%
jan 1, 1976
6.649 bln
+333.087 mln
5.27%
jan 1, 1977
6.857 bln
+208.742 mln
3.14%
jan 1, 1978
7.014 bln
+156.727 mln
2.29%
jan 1, 1979
7.221 bln
+206.901 mln
2.95%
jan 1, 1980
7.476 bln
+255.03 mln
3.53%
jan 1, 1981
7.686 bln
+210.241 mln
2.81%
jan 1, 1982
7.82 bln
+133.685 mln
1.74%
jan 1, 1983
7.851 bln
+30.814 mln
0.39%
jan 1, 1984
7.889 bln
+38.653 mln
0.49%
jan 1, 1985
8.003 bln
+114.051 mln
1.45%
jan 1, 1986
8.22 bln
+216.027 mln
2.7%
jan 1, 1987
8.488 bln
+268.45 mln
3.27%
jan 1, 1988
8.877 bln
+388.919 mln
4.58%
jan 1, 1989
9.407 bln
+530.328 mln
5.97%
jan 1, 1990
9.862 bln
+454.683 mln
4.83%
jan 1, 1991
10.234 bln
+372.557 mln
3.78%
jan 1, 1992
10.953 bln
+718.873 mln
7.02%
jan 1, 1993
10.698 bln
-255.17 mln
-2.33%
jan 1, 1994
10.918 bln
+219.773 mln
2.05%
jan 1, 1995
11.359 bln
+441.494 mln
4.04%
jan 1, 1996
11.573 bln
+213.473 mln
1.88%
jan 1, 1997
11.647 bln
+73.77 mln
0.64%
jan 1, 1998
12.071 bln
+424.232 mln
3.64%
jan 1, 1999
12.512 bln
+441.268 mln
3.66%
jan 1, 2000
13.156 bln
+643.788 mln
5.15%
jan 1, 2001
13.962 bln
+805.564 mln
6.12%
jan 1, 2002
14.408 bln
+446.562 mln
3.2%
jan 1, 2003
15.038 bln
+630.331 mln
4.37%
jan 1, 2004
15.332 bln
+293.51 mln
1.95%
jan 1, 2005
15.435 bln
+102.914 mln
0.67%
jan 1, 2006
15.733 bln
+297.748 mln
1.93%
jan 1, 2007
16.246 bln
+513.245 mln
3.26%
jan 1, 2008
16.638 bln
+392.318 mln
2.41%
jan 1, 2009
16.866 bln
+227.55 mln
1.37%
jan 1, 2010
17.034 bln
+168.079 mln
1.0%
jan 1, 2011
17.317 bln
+283.179 mln
1.66%
jan 1, 2012
17.695 bln
+378.543 mln
2.19%
jan 1, 2013
18.167 bln
+471.523 mln
2.66%
jan 1, 2014
18.338 bln
+171.258 mln
0.94%
jan 1, 2015
19.019 bln
+681.192 mln
3.71%
jan 1, 2016
19.046 bln
+26.49 mln
0.14%
Ranking of countries by current statistics by years


Comments: