29
/
en
AIzaSyAYiBZKx7MnpbEhh9jyipgxe19OcubqV5w
April 1, 2024
38222
IDA blend
IDB
false
2
1
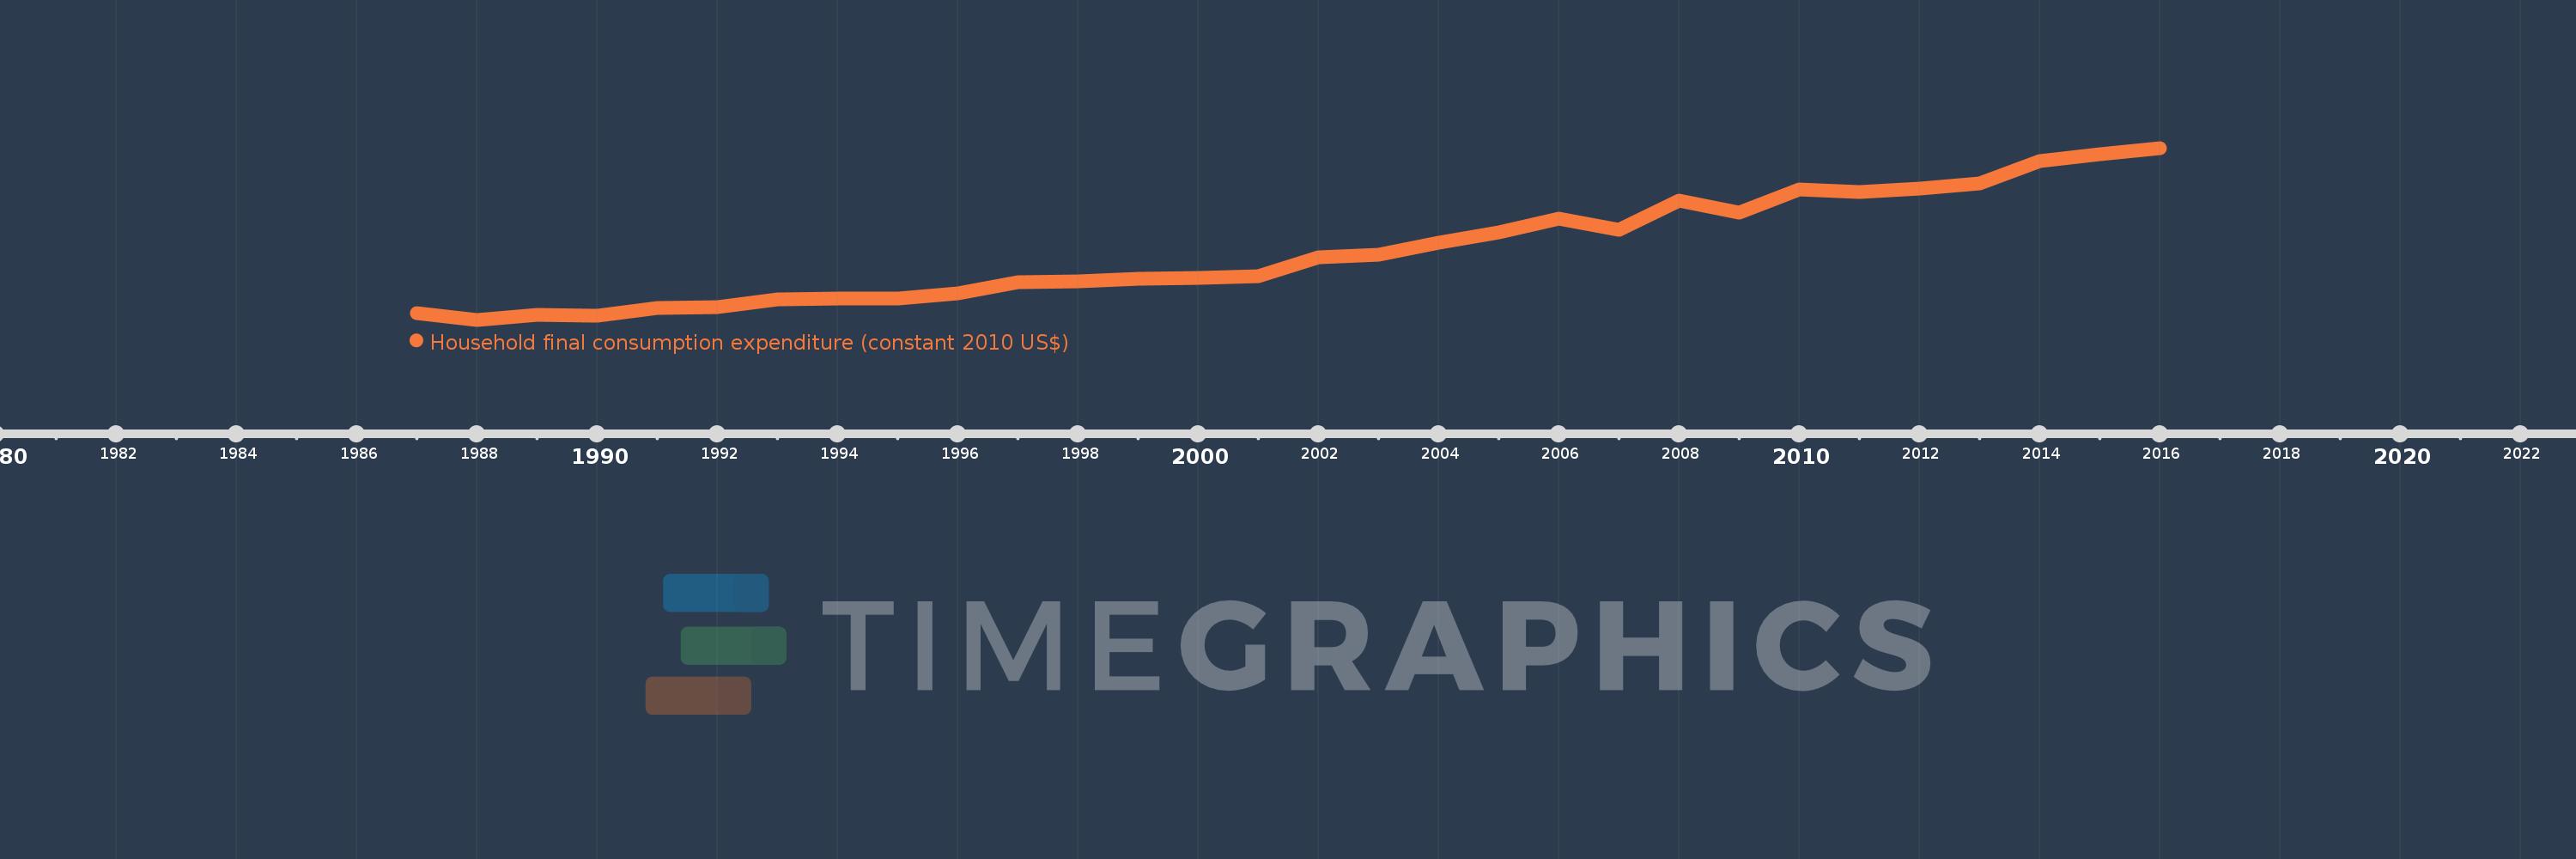
Household final consumption expenditure (constant 2010 US$)
2016,2015,2014,2013,2012,2011,2010,2009,2008,2007,2006,2005,2004,2003,2002,2001,2000,1999,1998,1997,1996,1995,1994,1993,1992,1991,1990,1989,1988,1987
This statistics in other country:
AfghanistanAlbaniaAlgeriaAngolaAntigua and BarbudaArab WorldArgentinaArmeniaArubaAustraliaAustriaAzerbaijanBahamas, TheBahrainBangladeshBarbadosBelarusBelgiumBelizeBeninBermudaBhutanBoliviaBosnia and HerzegovinaBotswanaBrazilBrunei DarussalamBulgariaBurkina FasoBurundiCabo VerdeCambodiaCameroonCanadaCaribbean small statesCentral African RepublicCentral Europe and the BalticsChadChileChinaColombiaComorosCongo, Dem. Rep.Congo, Rep.Costa RicaCote d'IvoireCroatiaCubaCyprusCzech RepublicDenmarkDominicaDominican RepublicEarly-demographic dividendEast Asia & PacificEast Asia & Pacific (excluding high income)East Asia & Pacific (IDA & IBRD countries)EcuadorEgypt, Arab Rep.El SalvadorEquatorial GuineaEritreaEstoniaEuro areaEurope & Central AsiaEurope & Central Asia (excluding high income)Europe & Central Asia (IDA & IBRD countries)European UnionFaroe IslandsFinlandFranceGabonGambia, TheGeorgiaGermanyGhanaGreeceGrenadaGuatemalaGuineaGuinea-BissauGuyanaHaitiHeavily indebted poor countries (HIPC)High incomeHondurasHong Kong SAR, ChinaHungaryIBRD onlyIcelandIDA & IBRD totalIDA blendIDA onlyIDA totalIndiaIndonesiaIran, Islamic Rep.IrelandIsraelItalyJamaicaJapanJordanKazakhstanKenyaKorea, Rep.KosovoKuwaitKyrgyz RepublicLao PDRLate-demographic dividendLatin America & Caribbean Latin America & Caribbean (excluding high income)Latin America & the Caribbean (IDA & IBRD countries)LatviaLeast developed countries: UN classificationLebanonLiberiaLithuaniaLow & middle incomeLow incomeLower middle incomeLuxembourgMacao SAR, ChinaMacedonia, FYRMadagascarMalawiMalaysiaMaliMaltaMauritaniaMauritiusMexicoMiddle East & North AfricaMiddle East & North Africa (excluding high income)Middle East & North Africa (IDA & IBRD countries)Middle incomeMoldovaMongoliaMontenegroMoroccoMozambiqueNamibiaNepalNetherlandsNew ZealandNicaraguaNigerNigeriaNorth AmericaNorwayOECD membersOmanOther small statesPakistanPanamaParaguayPeruPhilippinesPolandPortugalPost-demographic dividendPre-demographic dividendPuerto RicoQatarRomaniaRussian FederationRwandaSaudi ArabiaSenegalSerbiaSeychellesSierra LeoneSingaporeSlovak RepublicSloveniaSmall statesSouth AfricaSouth AsiaSouth Asia (IDA & IBRD)South SudanSpainSri LankaSt. Kitts and NevisSt. LuciaSt. Vincent and the GrenadinesSub-Saharan Africa Sub-Saharan Africa (excluding high income)Sub-Saharan Africa (IDA & IBRD countries)SudanSurinameSwazilandSwedenSwitzerlandTajikistanTanzaniaThailandTimor-LesteTogoTongaTrinidad and TobagoTunisiaTurkeyTurkmenistanUgandaUkraineUnited Arab EmiratesUnited KingdomUnited StatesUpper middle incomeUruguayUzbekistanVanuatuVenezuela, RBVietnamWest Bank and GazaWorldYemen, Rep.ZambiaZimbabwe Timeline:
This timeline shows a graph from 1987 to 2016 of IDA blend. No data until 1986. Number of actual observations by date: 30.
Source name:
World Development Indicators
Source organization:
World Bank national accounts data, and OECD National Accounts data files.
Categories, topics:
Economy & Growth
Last updated:
apr 23, 2017
Indicators value changes by year
Minimum:
195.667 bln
jan 1, 1988
Maximum:
719.427 bln
jan 1, 2016
At the date of observation
Value
Absolute change
Change from previous value
jan 1, 1987
214.795 bln
+214.795 bln
0.0%
jan 1, 1988
195.667 bln
-19.128 bln
-8.91%
jan 1, 1989
210.914 bln
+15.247 bln
7.79%
jan 1, 1990
207.484 bln
-3.43 bln
-1.63%
jan 1, 1991
230.581 bln
+23.096 bln
11.13%
jan 1, 1992
234.474 bln
+3.893 bln
1.69%
jan 1, 1993
257.583 bln
+23.11 bln
9.86%
jan 1, 1994
260.49 bln
+2.907 bln
1.13%
jan 1, 1995
259.804 bln
-686.722 mln
-0.26%
jan 1, 1996
276.199 bln
+16.396 bln
6.31%
jan 1, 1997
309.336 bln
+33.137 bln
12.0%
jan 1, 1998
313.52 bln
+4.184 bln
1.35%
jan 1, 1999
319.509 bln
+5.989 bln
1.91%
jan 1, 2000
323.198 bln
+3.689 bln
1.15%
jan 1, 2001
329.14 bln
+5.942 bln
1.84%
jan 1, 2002
385.171 bln
+56.031 bln
17.02%
jan 1, 2003
393.49 bln
+8.319 bln
2.16%
jan 1, 2004
429.319 bln
+35.829 bln
9.11%
jan 1, 2005
462.34 bln
+33.021 bln
7.69%
jan 1, 2006
503.355 bln
+41.016 bln
8.87%
jan 1, 2007
469.85 bln
-33.506 bln
-6.66%
jan 1, 2008
557.591 bln
+87.741 bln
18.67%
jan 1, 2009
521.653 bln
-35.938 bln
-6.45%
jan 1, 2010
593.77 bln
+72.116 bln
13.82%
jan 1, 2011
584.319 bln
-9.451 bln
-1.59%
jan 1, 2012
594.249 bln
+9.93 bln
1.7%
jan 1, 2013
611.387 bln
+17.138 bln
2.88%
jan 1, 2014
679.493 bln
+68.105 bln
11.14%
jan 1, 2015
700.871 bln
+21.378 bln
3.15%
jan 1, 2016
719.427 bln
+18.556 bln
2.65%
Ranking of countries by current statistics by years


Comments: