29
/
en
AIzaSyAYiBZKx7MnpbEhh9jyipgxe19OcubqV5w
April 1, 2024
282384
Vietnam
VNM
true
2
1
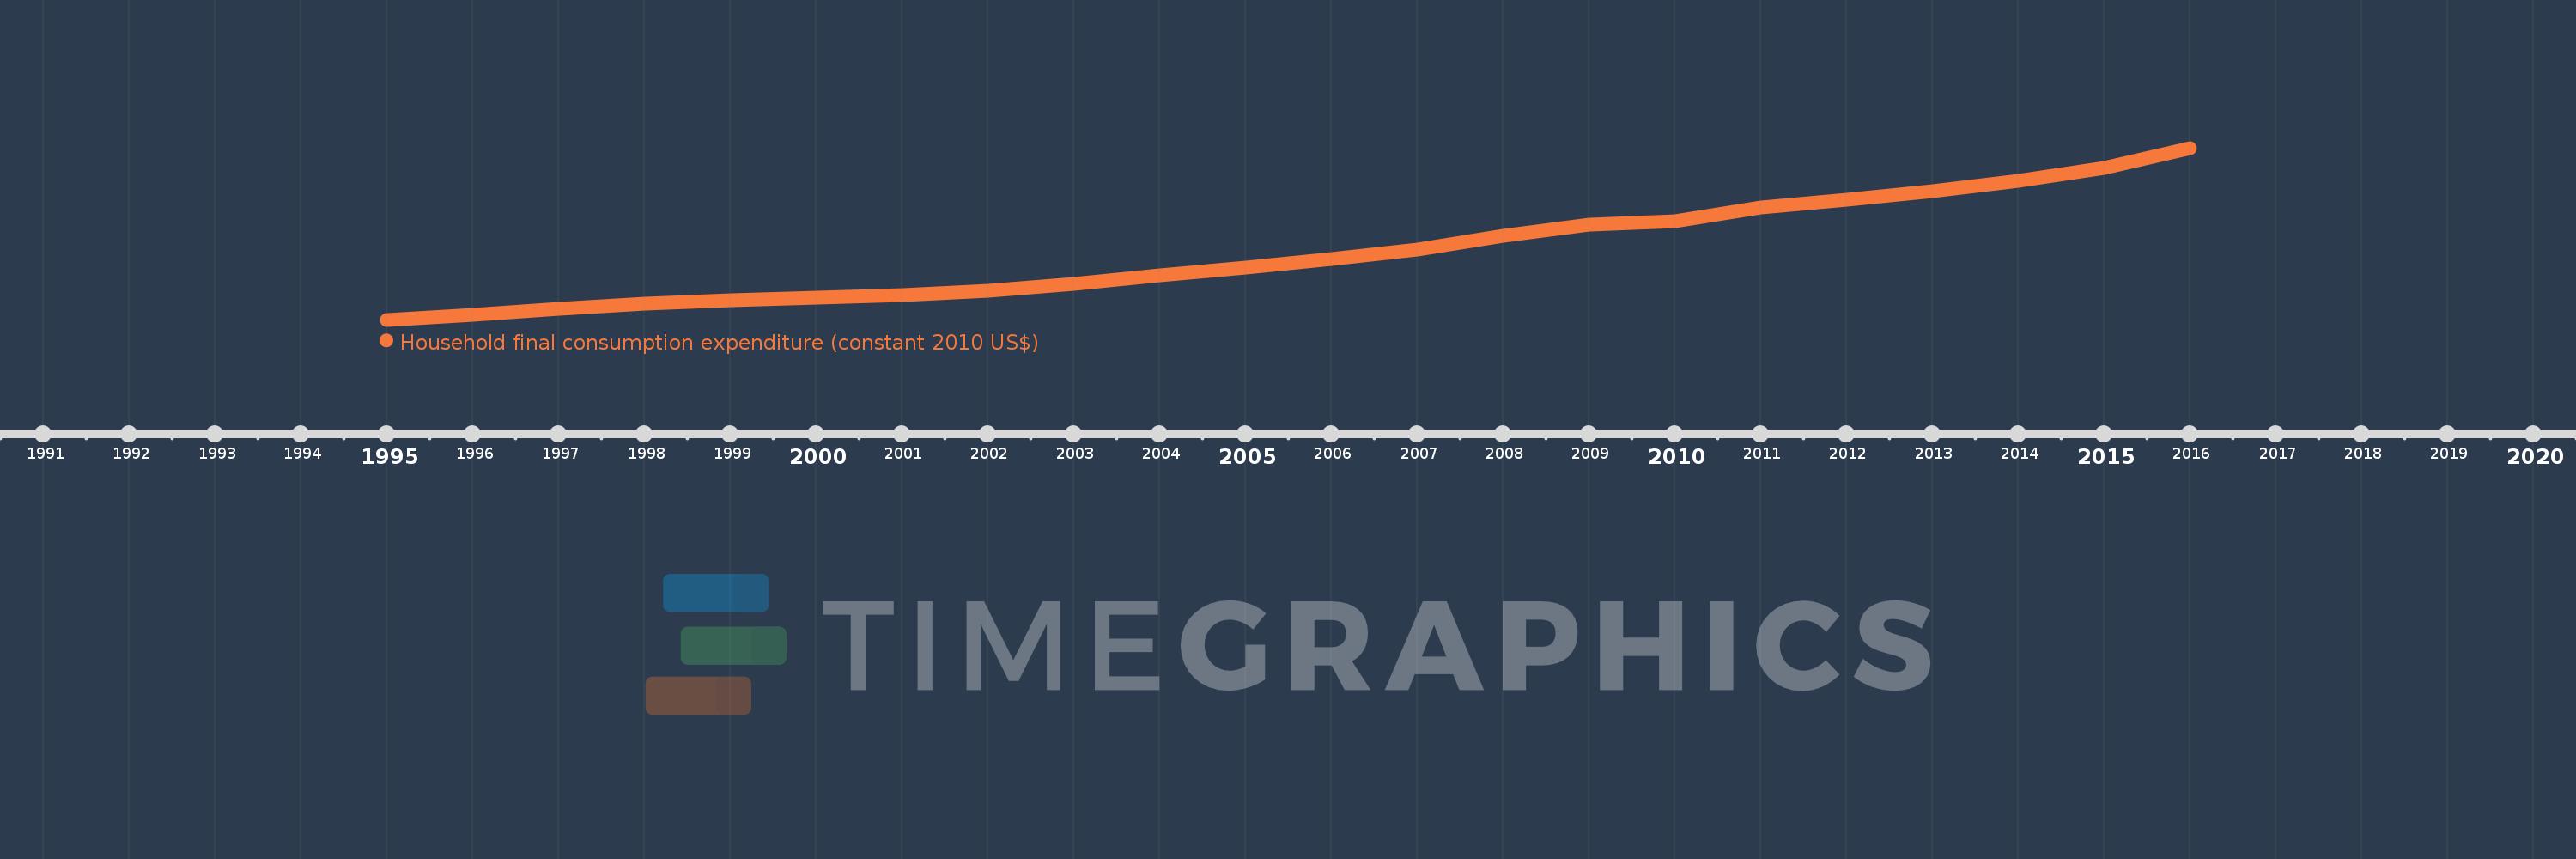
Household final consumption expenditure (constant 2010 US$)
2016,2015,2014,2013,2012,2011,2010,2009,2008,2007,2006,2005,2004,2003,2002,2001,2000,1999,1998,1997,1996,1995
This statistics in other country:
AfghanistanAlbaniaAlgeriaAngolaAntigua and BarbudaArab WorldArgentinaArmeniaArubaAustraliaAustriaAzerbaijanBahamas, TheBahrainBangladeshBarbadosBelarusBelgiumBelizeBeninBermudaBhutanBoliviaBosnia and HerzegovinaBotswanaBrazilBrunei DarussalamBulgariaBurkina FasoBurundiCabo VerdeCambodiaCameroonCanadaCaribbean small statesCentral African RepublicCentral Europe and the BalticsChadChileChinaColombiaComorosCongo, Dem. Rep.Congo, Rep.Costa RicaCote d'IvoireCroatiaCubaCyprusCzech RepublicDenmarkDominicaDominican RepublicEarly-demographic dividendEast Asia & PacificEast Asia & Pacific (excluding high income)East Asia & Pacific (IDA & IBRD countries)EcuadorEgypt, Arab Rep.El SalvadorEquatorial GuineaEritreaEstoniaEuro areaEurope & Central AsiaEurope & Central Asia (excluding high income)Europe & Central Asia (IDA & IBRD countries)European UnionFaroe IslandsFinlandFranceGabonGambia, TheGeorgiaGermanyGhanaGreeceGrenadaGuatemalaGuineaGuinea-BissauGuyanaHaitiHeavily indebted poor countries (HIPC)High incomeHondurasHong Kong SAR, ChinaHungaryIBRD onlyIcelandIDA & IBRD totalIDA blendIDA onlyIDA totalIndiaIndonesiaIran, Islamic Rep.IrelandIsraelItalyJamaicaJapanJordanKazakhstanKenyaKorea, Rep.KosovoKuwaitKyrgyz RepublicLao PDRLate-demographic dividendLatin America & Caribbean Latin America & Caribbean (excluding high income)Latin America & the Caribbean (IDA & IBRD countries)LatviaLeast developed countries: UN classificationLebanonLiberiaLithuaniaLow & middle incomeLow incomeLower middle incomeLuxembourgMacao SAR, ChinaMacedonia, FYRMadagascarMalawiMalaysiaMaliMaltaMauritaniaMauritiusMexicoMiddle East & North AfricaMiddle East & North Africa (excluding high income)Middle East & North Africa (IDA & IBRD countries)Middle incomeMoldovaMongoliaMontenegroMoroccoMozambiqueNamibiaNepalNetherlandsNew ZealandNicaraguaNigerNigeriaNorth AmericaNorwayOECD membersOmanOther small statesPakistanPanamaParaguayPeruPhilippinesPolandPortugalPost-demographic dividendPre-demographic dividendPuerto RicoQatarRomaniaRussian FederationRwandaSaudi ArabiaSenegalSerbiaSeychellesSierra LeoneSingaporeSlovak RepublicSloveniaSmall statesSouth AfricaSouth AsiaSouth Asia (IDA & IBRD)South SudanSpainSri LankaSt. Kitts and NevisSt. LuciaSt. Vincent and the GrenadinesSub-Saharan Africa Sub-Saharan Africa (excluding high income)Sub-Saharan Africa (IDA & IBRD countries)SudanSurinameSwazilandSwedenSwitzerlandTajikistanTanzaniaThailandTimor-LesteTogoTongaTrinidad and TobagoTunisiaTurkeyTurkmenistanUgandaUkraineUnited Arab EmiratesUnited KingdomUnited StatesUpper middle incomeUruguayUzbekistanVanuatuVenezuela, RBVietnamWest Bank and GazaWorldYemen, Rep.ZambiaZimbabwe Timeline:
This timeline shows a graph from 1995 to 2016 of Vietnam. No data until 1994. Number of actual observations by date: 22.
Source name:
World Development Indicators
Source organization:
World Bank national accounts data, and OECD National Accounts data files.
Categories, topics:
Economy & Growth
Last updated:
apr 23, 2017
Indicators value changes by year
Minimum:
28.765 bln
jan 1, 1995
Maximum:
102.807 bln
jan 1, 2016
At the date of observation
Value
Absolute change
Change from previous value
jan 1, 1995
28.765 bln
+28.765 bln
0.0%
jan 1, 1996
30.841 bln
+2.075 bln
7.21%
jan 1, 1997
33.644 bln
+2.804 bln
9.09%
jan 1, 1998
35.633 bln
+1.989 bln
5.91%
jan 1, 1999
37.224 bln
+1.591 bln
4.47%
jan 1, 2000
38.191 bln
+966.333 mln
2.6%
jan 1, 2001
39.365 bln
+1.175 bln
3.08%
jan 1, 2002
41.126 bln
+1.76 bln
4.47%
jan 1, 2003
44.263 bln
+3.137 bln
7.63%
jan 1, 2004
47.808 bln
+3.546 bln
8.01%
jan 1, 2005
51.2 bln
+3.392 bln
7.09%
jan 1, 2006
54.917 bln
+3.716 bln
7.26%
jan 1, 2007
59.016 bln
+4.1 bln
7.47%
jan 1, 2008
64.788 bln
+5.772 bln
9.78%
jan 1, 2009
69.756 bln
+4.968 bln
7.67%
jan 1, 2010
71.327 bln
+1.571 bln
2.25%
jan 1, 2011
77.166 bln
+5.839 bln
8.19%
jan 1, 2012
80.328 bln
+3.161 bln
4.1%
jan 1, 2013
84.247 bln
+3.919 bln
4.88%
jan 1, 2014
88.612 bln
+4.365 bln
5.18%
jan 1, 2015
94.034 bln
+5.422 bln
6.12%
jan 1, 2016
102.807 bln
+8.773 bln
9.33%
Ranking of countries by current statistics by years


Comments: