29
/
en
AIzaSyAYiBZKx7MnpbEhh9jyipgxe19OcubqV5w
April 1, 2024
187881
Malaysia
MYS
true
2
1
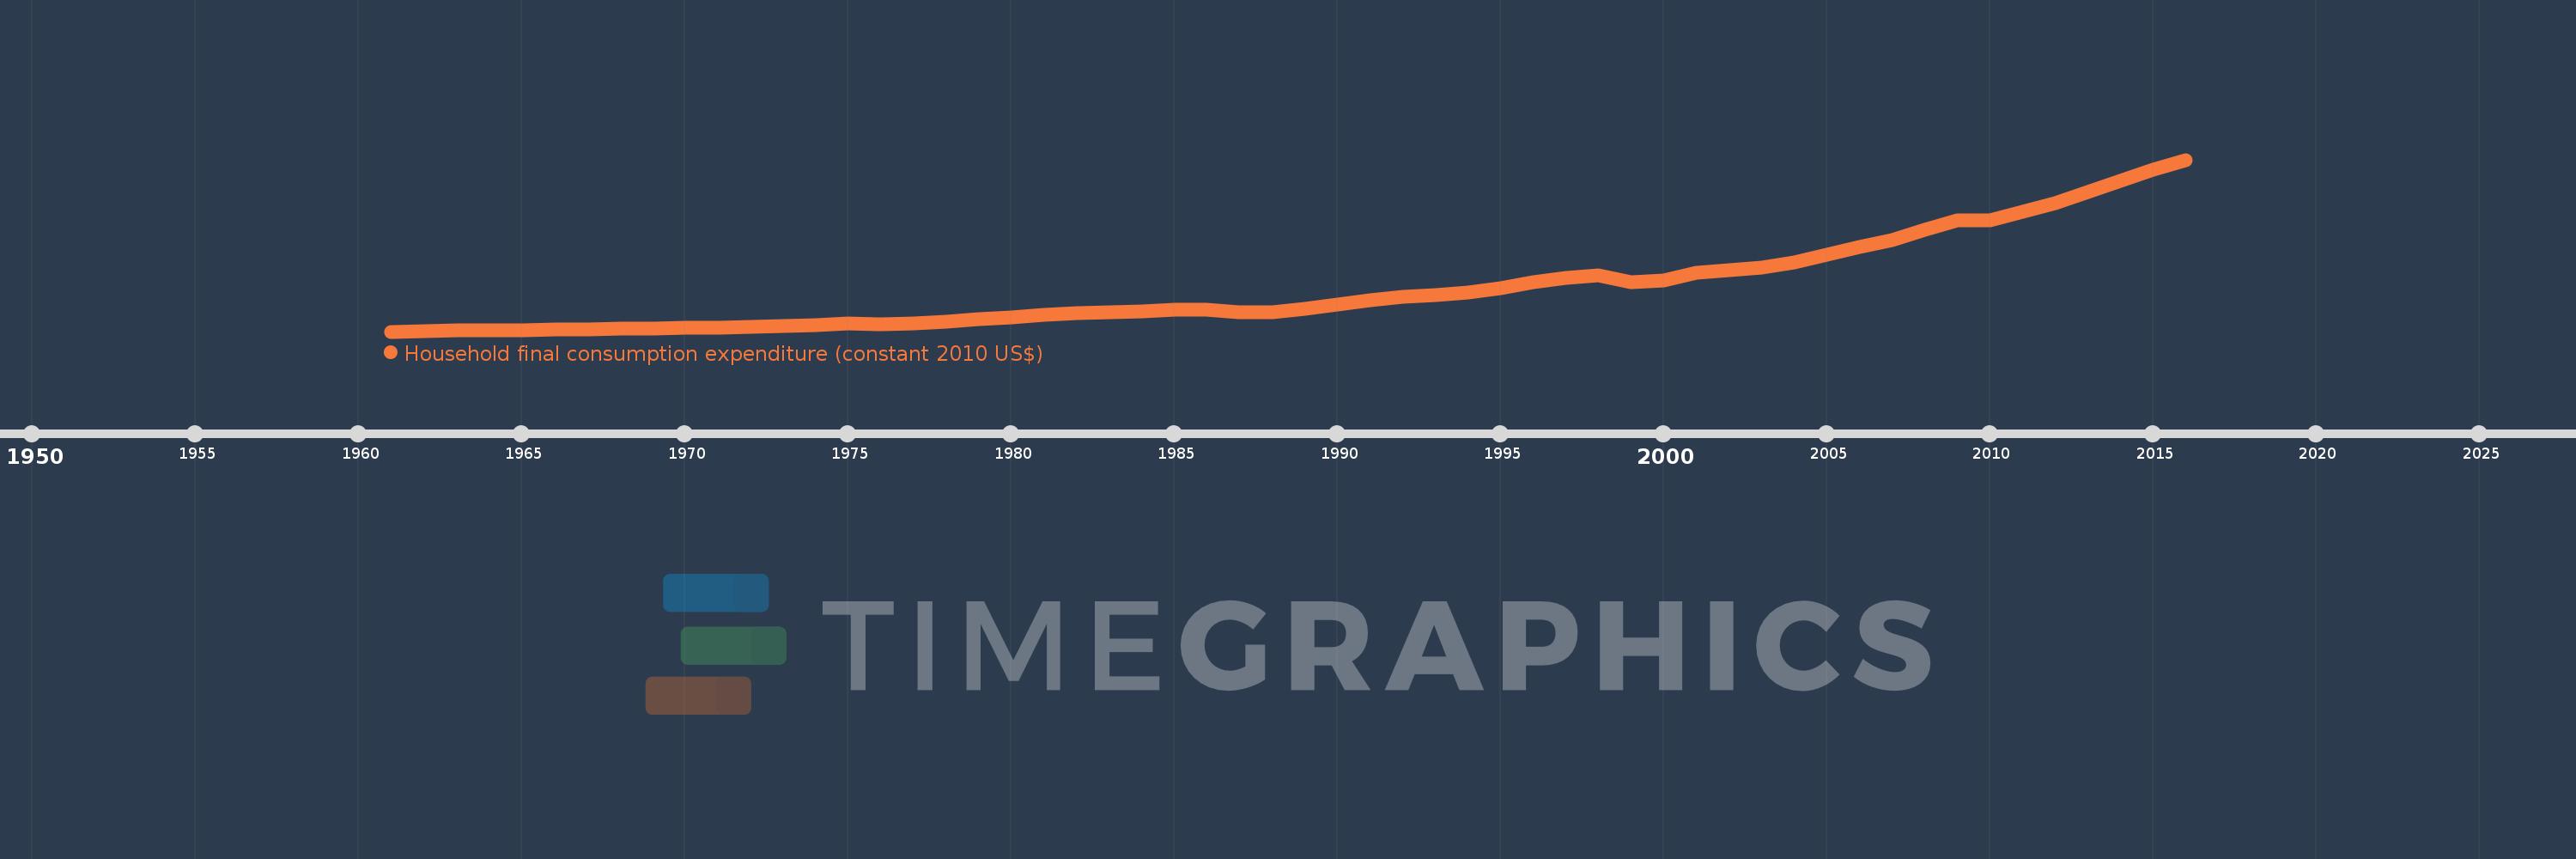
Household final consumption expenditure (constant 2010 US$)
2016,2015,2014,2013,2012,2011,2010,2009,2008,2007,2006,2005,2004,2003,2002,2001,2000,1999,1998,1997,1996,1995,1994,1993,1992,1991,1990,1989,1988,1987,1986,1985,1984,1983,1982,1981,1980,1979,1978,1977,1976,1975,1974,1973,1972,1971,1970,1969,1968,1967,1966,1965,1964,1963,1962,1961
This statistics in other country:
AfghanistanAlbaniaAlgeriaAngolaAntigua and BarbudaArab WorldArgentinaArmeniaArubaAustraliaAustriaAzerbaijanBahamas, TheBahrainBangladeshBarbadosBelarusBelgiumBelizeBeninBermudaBhutanBoliviaBosnia and HerzegovinaBotswanaBrazilBrunei DarussalamBulgariaBurkina FasoBurundiCabo VerdeCambodiaCameroonCanadaCaribbean small statesCentral African RepublicCentral Europe and the BalticsChadChileChinaColombiaComorosCongo, Dem. Rep.Congo, Rep.Costa RicaCote d'IvoireCroatiaCubaCyprusCzech RepublicDenmarkDominicaDominican RepublicEarly-demographic dividendEast Asia & PacificEast Asia & Pacific (excluding high income)East Asia & Pacific (IDA & IBRD countries)EcuadorEgypt, Arab Rep.El SalvadorEquatorial GuineaEritreaEstoniaEuro areaEurope & Central AsiaEurope & Central Asia (excluding high income)Europe & Central Asia (IDA & IBRD countries)European UnionFaroe IslandsFinlandFranceGabonGambia, TheGeorgiaGermanyGhanaGreeceGrenadaGuatemalaGuineaGuinea-BissauGuyanaHaitiHeavily indebted poor countries (HIPC)High incomeHondurasHong Kong SAR, ChinaHungaryIBRD onlyIcelandIDA & IBRD totalIDA blendIDA onlyIDA totalIndiaIndonesiaIran, Islamic Rep.IrelandIsraelItalyJamaicaJapanJordanKazakhstanKenyaKorea, Rep.KosovoKuwaitKyrgyz RepublicLao PDRLate-demographic dividendLatin America & Caribbean Latin America & Caribbean (excluding high income)Latin America & the Caribbean (IDA & IBRD countries)LatviaLeast developed countries: UN classificationLebanonLiberiaLithuaniaLow & middle incomeLow incomeLower middle incomeLuxembourgMacao SAR, ChinaMacedonia, FYRMadagascarMalawiMalaysiaMaliMaltaMauritaniaMauritiusMexicoMiddle East & North AfricaMiddle East & North Africa (excluding high income)Middle East & North Africa (IDA & IBRD countries)Middle incomeMoldovaMongoliaMontenegroMoroccoMozambiqueNamibiaNepalNetherlandsNew ZealandNicaraguaNigerNigeriaNorth AmericaNorwayOECD membersOmanOther small statesPakistanPanamaParaguayPeruPhilippinesPolandPortugalPost-demographic dividendPre-demographic dividendPuerto RicoQatarRomaniaRussian FederationRwandaSaudi ArabiaSenegalSerbiaSeychellesSierra LeoneSingaporeSlovak RepublicSloveniaSmall statesSouth AfricaSouth AsiaSouth Asia (IDA & IBRD)South SudanSpainSri LankaSt. Kitts and NevisSt. LuciaSt. Vincent and the GrenadinesSub-Saharan Africa Sub-Saharan Africa (excluding high income)Sub-Saharan Africa (IDA & IBRD countries)SudanSurinameSwazilandSwedenSwitzerlandTajikistanTanzaniaThailandTimor-LesteTogoTongaTrinidad and TobagoTunisiaTurkeyTurkmenistanUgandaUkraineUnited Arab EmiratesUnited KingdomUnited StatesUpper middle incomeUruguayUzbekistanVanuatuVenezuela, RBVietnamWest Bank and GazaWorldYemen, Rep.ZambiaZimbabwe Timeline:
This timeline shows a graph from 1961 to 2016 of Malaysia. No data until 1960. Number of actual observations by date: 56.
Source name:
World Development Indicators
Source organization:
World Bank national accounts data, and OECD National Accounts data files.
Categories, topics:
Economy & Growth
Last updated:
apr 23, 2017
Indicators value changes by year
Minimum:
7.587 bln
jan 1, 1961
Maximum:
172.658 bln
jan 1, 2016
At the date of observation
Value
Absolute change
Change from previous value
jan 1, 1961
7.587 bln
+7.587 bln
0.0%
jan 1, 1962
8.067 bln
+480.724 mln
6.34%
jan 1, 1963
8.461 bln
+393.409 mln
4.88%
jan 1, 1964
8.736 bln
+275.681 mln
3.26%
jan 1, 1965
9.198 bln
+461.103 mln
5.28%
jan 1, 1966
9.691 bln
+493.477 mln
5.37%
jan 1, 1967
10.06 bln
+368.882 mln
3.81%
jan 1, 1968
10.16 bln
+100.069 mln
0.99%
jan 1, 1969
10.318 bln
+157.952 mln
1.55%
jan 1, 1970
10.984 bln
+666.146 mln
6.46%
jan 1, 1971
11.356 bln
+371.825 mln
3.39%
jan 1, 1972
12.054 bln
+698.522 mln
6.15%
jan 1, 1973
12.69 bln
+635.733 mln
5.27%
jan 1, 1974
13.802 bln
+1.112 bln
8.76%
jan 1, 1975
15.044 bln
+1.242 bln
9.0%
jan 1, 1976
14.955 bln
-88.295 mln
-0.59%
jan 1, 1977
15.809 bln
+853.53 mln
5.71%
jan 1, 1978
17.412 bln
+1.603 bln
10.14%
jan 1, 1979
19.213 bln
+1.801 bln
10.34%
jan 1, 1980
21.287 bln
+2.074 bln
10.79%
jan 1, 1981
23.982 bln
+2.695 bln
12.66%
jan 1, 1982
25.2 bln
+1.218 bln
5.08%
jan 1, 1983
26.029 bln
+829.001 mln
3.29%
jan 1, 1984
26.858 bln
+829.004 mln
3.18%
jan 1, 1985
28.59 bln
+1.733 bln
6.45%
jan 1, 1986
28.688 bln
+98.108 mln
0.34%
jan 1, 1987
25.817 bln
-2.872 bln
-10.01%
jan 1, 1988
26.349 bln
+531.739 mln
2.06%
jan 1, 1989
29.447 bln
+3.099 bln
11.76%
jan 1, 1990
33.37 bln
+3.923 bln
13.32%
jan 1, 1991
37.337 bln
+3.967 bln
11.89%
jan 1, 1992
40.714 bln
+3.377 bln
9.05%
jan 1, 1993
42.609 bln
+1.895 bln
4.65%
jan 1, 1994
45.273 bln
+2.664 bln
6.25%
jan 1, 1995
49.524 bln
+4.251 bln
9.39%
jan 1, 1996
55.297 bln
+5.773 bln
11.66%
jan 1, 1997
59.094 bln
+3.796 bln
6.87%
jan 1, 1998
61.641 bln
+2.547 bln
4.31%
jan 1, 1999
55.331 bln
-6.309 bln
-10.24%
jan 1, 2000
56.914 bln
+1.582 bln
2.86%
jan 1, 2001
64.328 bln
+7.415 bln
13.03%
jan 1, 2002
66.276 bln
+1.947 bln
3.03%
jan 1, 2003
68.842 bln
+2.566 bln
3.87%
jan 1, 2004
74.428 bln
+5.585 bln
8.11%
jan 1, 2005
81.758 bln
+7.33 bln
9.85%
jan 1, 2006
89.206 bln
+7.448 bln
9.11%
jan 1, 2007
95.103 bln
+5.897 bln
6.61%
jan 1, 2008
105.035 bln
+9.932 bln
10.44%
jan 1, 2009
114.193 bln
+9.158 bln
8.72%
jan 1, 2010
114.826 bln
+632.494 mln
0.55%
jan 1, 2011
122.596 bln
+7.77 bln
6.77%
jan 1, 2012
131.03 bln
+8.434 bln
6.88%
jan 1, 2013
141.956 bln
+10.926 bln
8.34%
jan 1, 2014
152.252 bln
+10.296 bln
7.25%
jan 1, 2015
162.878 bln
+10.626 bln
6.98%
jan 1, 2016
172.658 bln
+9.781 bln
6.01%
Ranking of countries by current statistics by years


Comments: