29
/
en
AIzaSyAYiBZKx7MnpbEhh9jyipgxe19OcubqV5w
April 1, 2024
228577
Romania
ROU
true
2
1
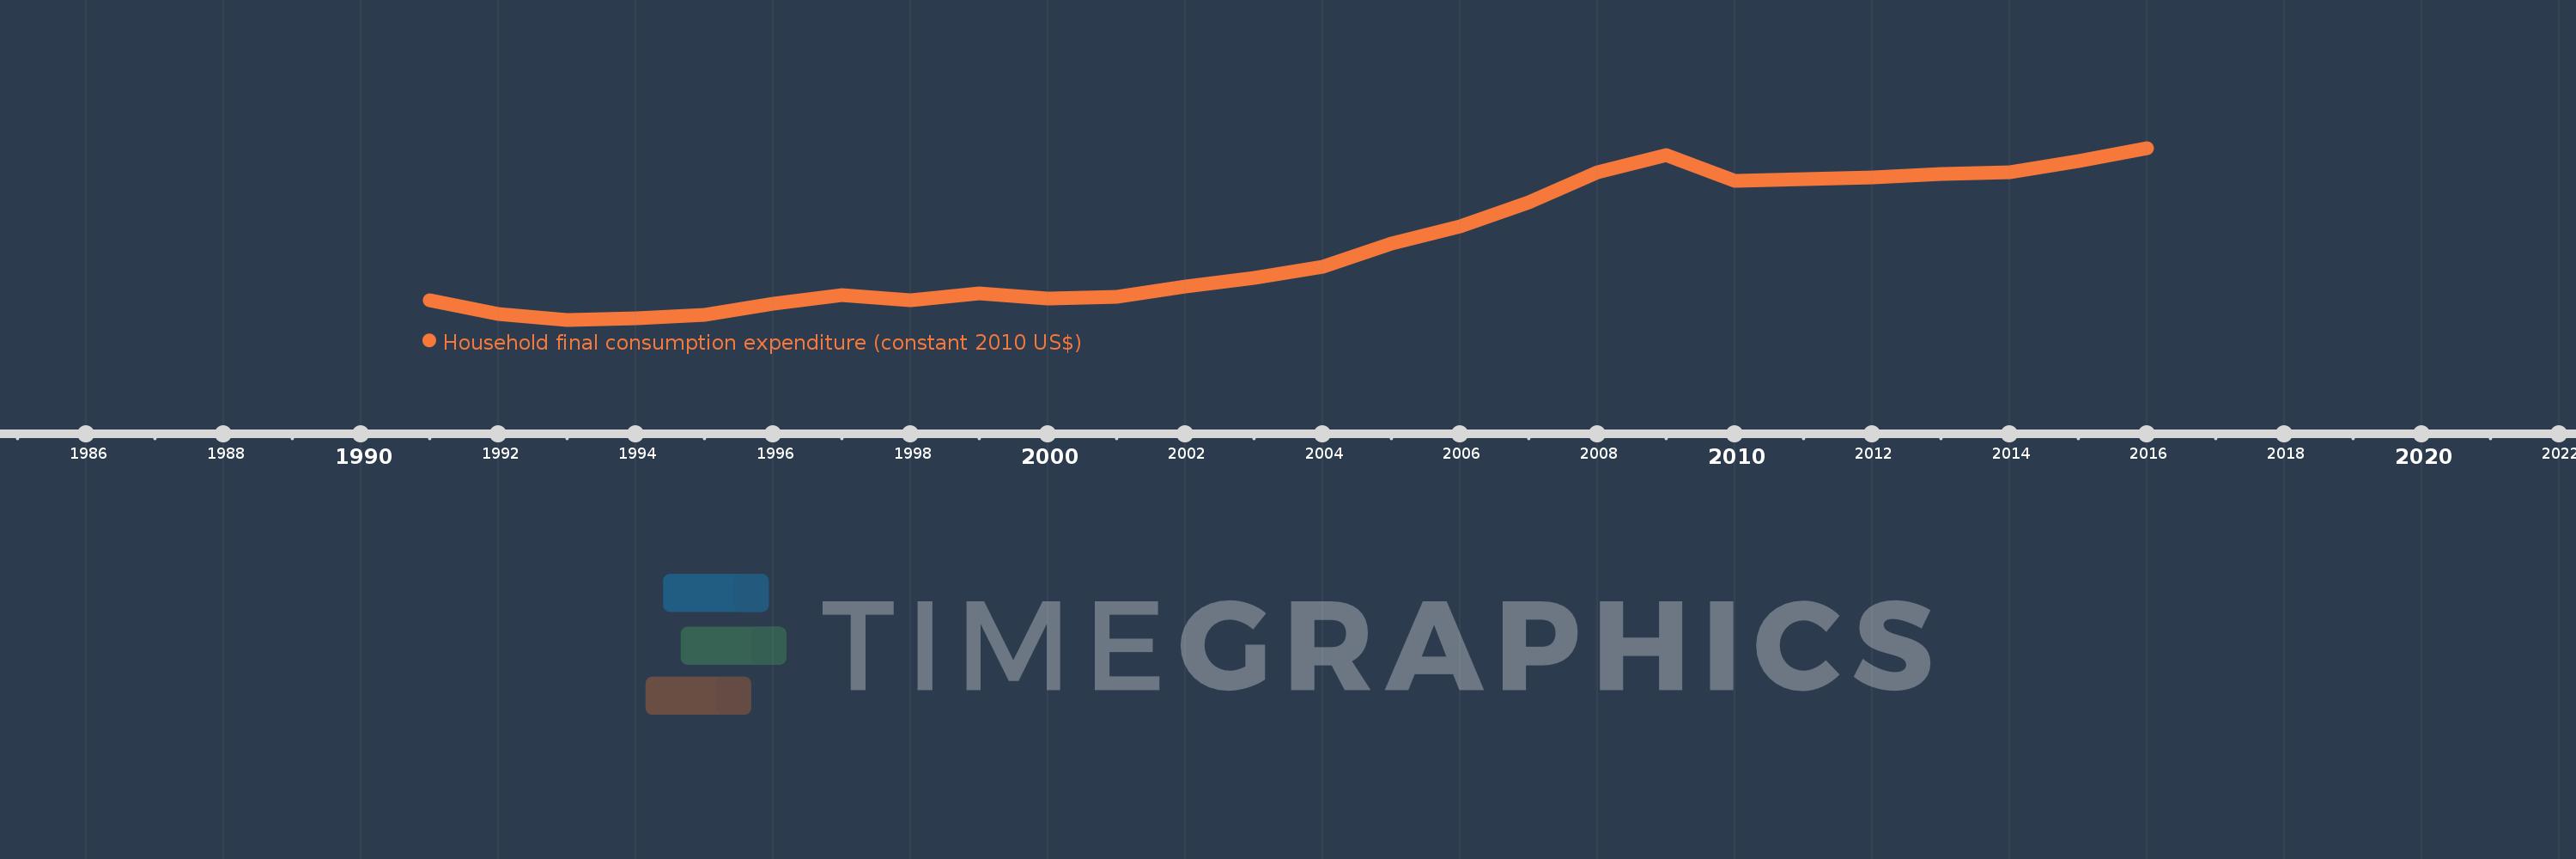
Household final consumption expenditure (constant 2010 US$)
2016,2015,2014,2013,2012,2011,2010,2009,2008,2007,2006,2005,2004,2003,2002,2001,2000,1999,1998,1997,1996,1995,1994,1993,1992,1991
This statistics in other country:
AfghanistanAlbaniaAlgeriaAngolaAntigua and BarbudaArab WorldArgentinaArmeniaArubaAustraliaAustriaAzerbaijanBahamas, TheBahrainBangladeshBarbadosBelarusBelgiumBelizeBeninBermudaBhutanBoliviaBosnia and HerzegovinaBotswanaBrazilBrunei DarussalamBulgariaBurkina FasoBurundiCabo VerdeCambodiaCameroonCanadaCaribbean small statesCentral African RepublicCentral Europe and the BalticsChadChileChinaColombiaComorosCongo, Dem. Rep.Congo, Rep.Costa RicaCote d'IvoireCroatiaCubaCyprusCzech RepublicDenmarkDominicaDominican RepublicEarly-demographic dividendEast Asia & PacificEast Asia & Pacific (excluding high income)East Asia & Pacific (IDA & IBRD countries)EcuadorEgypt, Arab Rep.El SalvadorEquatorial GuineaEritreaEstoniaEuro areaEurope & Central AsiaEurope & Central Asia (excluding high income)Europe & Central Asia (IDA & IBRD countries)European UnionFaroe IslandsFinlandFranceGabonGambia, TheGeorgiaGermanyGhanaGreeceGrenadaGuatemalaGuineaGuinea-BissauGuyanaHaitiHeavily indebted poor countries (HIPC)High incomeHondurasHong Kong SAR, ChinaHungaryIBRD onlyIcelandIDA & IBRD totalIDA blendIDA onlyIDA totalIndiaIndonesiaIran, Islamic Rep.IrelandIsraelItalyJamaicaJapanJordanKazakhstanKenyaKorea, Rep.KosovoKuwaitKyrgyz RepublicLao PDRLate-demographic dividendLatin America & Caribbean Latin America & Caribbean (excluding high income)Latin America & the Caribbean (IDA & IBRD countries)LatviaLeast developed countries: UN classificationLebanonLiberiaLithuaniaLow & middle incomeLow incomeLower middle incomeLuxembourgMacao SAR, ChinaMacedonia, FYRMadagascarMalawiMalaysiaMaliMaltaMauritaniaMauritiusMexicoMiddle East & North AfricaMiddle East & North Africa (excluding high income)Middle East & North Africa (IDA & IBRD countries)Middle incomeMoldovaMongoliaMontenegroMoroccoMozambiqueNamibiaNepalNetherlandsNew ZealandNicaraguaNigerNigeriaNorth AmericaNorwayOECD membersOmanOther small statesPakistanPanamaParaguayPeruPhilippinesPolandPortugalPost-demographic dividendPre-demographic dividendPuerto RicoQatarRomaniaRussian FederationRwandaSaudi ArabiaSenegalSerbiaSeychellesSierra LeoneSingaporeSlovak RepublicSloveniaSmall statesSouth AfricaSouth AsiaSouth Asia (IDA & IBRD)South SudanSpainSri LankaSt. Kitts and NevisSt. LuciaSt. Vincent and the GrenadinesSub-Saharan Africa Sub-Saharan Africa (excluding high income)Sub-Saharan Africa (IDA & IBRD countries)SudanSurinameSwazilandSwedenSwitzerlandTajikistanTanzaniaThailandTimor-LesteTogoTongaTrinidad and TobagoTunisiaTurkeyTurkmenistanUgandaUkraineUnited Arab EmiratesUnited KingdomUnited StatesUpper middle incomeUruguayUzbekistanVanuatuVenezuela, RBVietnamWest Bank and GazaWorldYemen, Rep.ZambiaZimbabwe Timeline:
This timeline shows a graph from 1991 to 2016 of Romania. No data until 1990. Number of actual observations by date: 26.
Source name:
World Development Indicators
Source organization:
World Bank national accounts data, and OECD National Accounts data files.
Categories, topics:
Economy & Growth
Last updated:
apr 23, 2017
Indicators value changes by year
Minimum:
42.981 bln
jan 1, 1993
Maximum:
120.494 bln
jan 1, 2016
At the date of observation
Value
Absolute change
Change from previous value
jan 1, 1991
51.609 bln
+51.609 bln
0.0%
jan 1, 1992
45.524 bln
-6.085 bln
-11.79%
jan 1, 1993
42.981 bln
-2.543 bln
-5.59%
jan 1, 1994
43.516 bln
+534.516 mln
1.24%
jan 1, 1995
45.165 bln
+1.649 bln
3.79%
jan 1, 1996
50.039 bln
+4.874 bln
10.79%
jan 1, 1997
54.077 bln
+4.038 bln
8.07%
jan 1, 1998
51.67 bln
-2.407 bln
-4.45%
jan 1, 1999
54.77 bln
+3.1 bln
6.0%
jan 1, 2000
52.404 bln
-2.366 bln
-4.32%
jan 1, 2001
53.158 bln
+753.653 mln
1.44%
jan 1, 2002
58.15 bln
+4.992 bln
9.39%
jan 1, 2003
61.73 bln
+3.58 bln
6.16%
jan 1, 2004
66.844 bln
+5.114 bln
8.28%
jan 1, 2005
77.393 bln
+10.549 bln
15.78%
jan 1, 2006
85.214 bln
+7.821 bln
10.11%
jan 1, 2007
96.074 bln
+10.86 bln
12.74%
jan 1, 2008
109.64 bln
+13.565 bln
14.12%
jan 1, 2009
117.447 bln
+7.807 bln
7.12%
jan 1, 2010
105.546 bln
-11.9 bln
-10.13%
jan 1, 2011
106.549 bln
+1.003 bln
0.95%
jan 1, 2012
107.389 bln
+839.611 mln
0.79%
jan 1, 2013
108.72 bln
+1.331 bln
1.24%
jan 1, 2014
109.515 bln
+794.914 mln
0.73%
jan 1, 2015
114.658 bln
+5.143 bln
4.7%
jan 1, 2016
120.494 bln
+5.835 bln
5.09%
Ranking of countries by current statistics by years


Comments: