29
/
en
AIzaSyAYiBZKx7MnpbEhh9jyipgxe19OcubqV5w
April 1, 2024
224942
Poland
POL
true
2
1
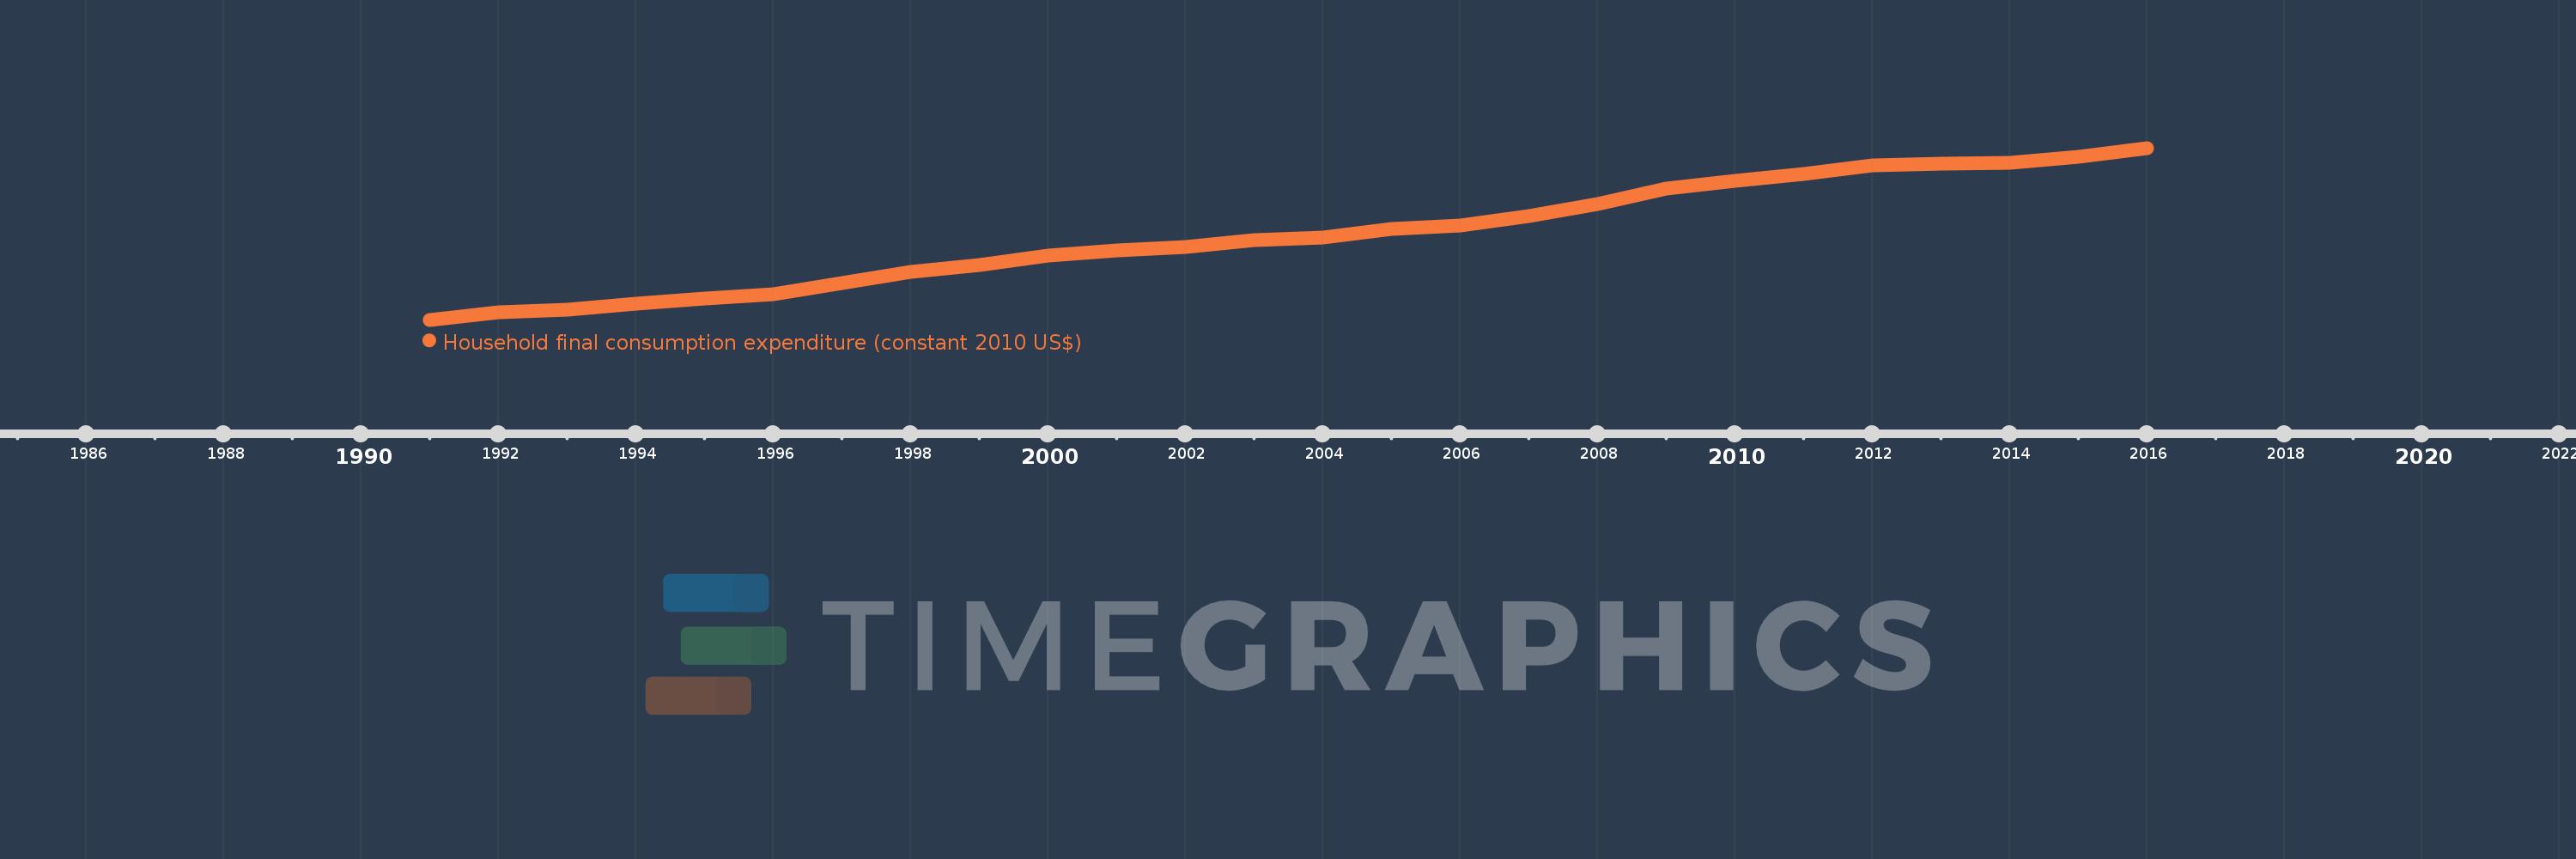
Household final consumption expenditure (constant 2010 US$)
2016,2015,2014,2013,2012,2011,2010,2009,2008,2007,2006,2005,2004,2003,2002,2001,2000,1999,1998,1997,1996,1995,1994,1993,1992,1991
This statistics in other country:
AfghanistanAlbaniaAlgeriaAngolaAntigua and BarbudaArab WorldArgentinaArmeniaArubaAustraliaAustriaAzerbaijanBahamas, TheBahrainBangladeshBarbadosBelarusBelgiumBelizeBeninBermudaBhutanBoliviaBosnia and HerzegovinaBotswanaBrazilBrunei DarussalamBulgariaBurkina FasoBurundiCabo VerdeCambodiaCameroonCanadaCaribbean small statesCentral African RepublicCentral Europe and the BalticsChadChileChinaColombiaComorosCongo, Dem. Rep.Congo, Rep.Costa RicaCote d'IvoireCroatiaCubaCyprusCzech RepublicDenmarkDominicaDominican RepublicEarly-demographic dividendEast Asia & PacificEast Asia & Pacific (excluding high income)East Asia & Pacific (IDA & IBRD countries)EcuadorEgypt, Arab Rep.El SalvadorEquatorial GuineaEritreaEstoniaEuro areaEurope & Central AsiaEurope & Central Asia (excluding high income)Europe & Central Asia (IDA & IBRD countries)European UnionFaroe IslandsFinlandFranceGabonGambia, TheGeorgiaGermanyGhanaGreeceGrenadaGuatemalaGuineaGuinea-BissauGuyanaHaitiHeavily indebted poor countries (HIPC)High incomeHondurasHong Kong SAR, ChinaHungaryIBRD onlyIcelandIDA & IBRD totalIDA blendIDA onlyIDA totalIndiaIndonesiaIran, Islamic Rep.IrelandIsraelItalyJamaicaJapanJordanKazakhstanKenyaKorea, Rep.KosovoKuwaitKyrgyz RepublicLao PDRLate-demographic dividendLatin America & Caribbean Latin America & Caribbean (excluding high income)Latin America & the Caribbean (IDA & IBRD countries)LatviaLeast developed countries: UN classificationLebanonLiberiaLithuaniaLow & middle incomeLow incomeLower middle incomeLuxembourgMacao SAR, ChinaMacedonia, FYRMadagascarMalawiMalaysiaMaliMaltaMauritaniaMauritiusMexicoMiddle East & North AfricaMiddle East & North Africa (excluding high income)Middle East & North Africa (IDA & IBRD countries)Middle incomeMoldovaMongoliaMontenegroMoroccoMozambiqueNamibiaNepalNetherlandsNew ZealandNicaraguaNigerNigeriaNorth AmericaNorwayOECD membersOmanOther small statesPakistanPanamaParaguayPeruPhilippinesPolandPortugalPost-demographic dividendPre-demographic dividendPuerto RicoQatarRomaniaRussian FederationRwandaSaudi ArabiaSenegalSerbiaSeychellesSierra LeoneSingaporeSlovak RepublicSloveniaSmall statesSouth AfricaSouth AsiaSouth Asia (IDA & IBRD)South SudanSpainSri LankaSt. Kitts and NevisSt. LuciaSt. Vincent and the GrenadinesSub-Saharan Africa Sub-Saharan Africa (excluding high income)Sub-Saharan Africa (IDA & IBRD countries)SudanSurinameSwazilandSwedenSwitzerlandTajikistanTanzaniaThailandTimor-LesteTogoTongaTrinidad and TobagoTunisiaTurkeyTurkmenistanUgandaUkraineUnited Arab EmiratesUnited KingdomUnited StatesUpper middle incomeUruguayUzbekistanVanuatuVenezuela, RBVietnamWest Bank and GazaWorldYemen, Rep.ZambiaZimbabwe Timeline:
This timeline shows a graph from 1991 to 2016 of Poland. No data until 1990. Number of actual observations by date: 26.
Source name:
World Development Indicators
Source organization:
World Bank national accounts data, and OECD National Accounts data files.
Categories, topics:
Economy & Growth
Last updated:
apr 23, 2017
Indicators value changes by year
Minimum:
124.827 bln
jan 1, 1991
Maximum:
325.113 bln
jan 1, 2016
At the date of observation
Value
Absolute change
Change from previous value
jan 1, 1991
124.827 bln
+124.827 bln
0.0%
jan 1, 1992
133.087 bln
+8.26 bln
6.62%
jan 1, 1993
136.247 bln
+3.16 bln
2.37%
jan 1, 1994
143.551 bln
+7.304 bln
5.36%
jan 1, 1995
150.0 bln
+6.449 bln
4.49%
jan 1, 1996
154.751 bln
+4.752 bln
3.17%
jan 1, 1997
168.008 bln
+13.257 bln
8.57%
jan 1, 1998
180.339 bln
+12.331 bln
7.34%
jan 1, 1999
189.108 bln
+8.769 bln
4.86%
jan 1, 2000
199.532 bln
+10.424 bln
5.51%
jan 1, 2001
205.277 bln
+5.745 bln
2.88%
jan 1, 2002
209.393 bln
+4.117 bln
2.01%
jan 1, 2003
217.63 bln
+8.236 bln
3.93%
jan 1, 2004
221.083 bln
+3.453 bln
1.59%
jan 1, 2005
230.474 bln
+9.391 bln
4.25%
jan 1, 2006
234.567 bln
+4.092 bln
1.78%
jan 1, 2007
245.826 bln
+11.26 bln
4.8%
jan 1, 2008
259.714 bln
+13.888 bln
5.65%
jan 1, 2009
277.257 bln
+17.543 bln
6.75%
jan 1, 2010
287.207 bln
+9.95 bln
3.59%
jan 1, 2011
295.095 bln
+7.888 bln
2.75%
jan 1, 2012
304.387 bln
+9.292 bln
3.15%
jan 1, 2013
306.665 bln
+2.278 bln
0.75%
jan 1, 2014
307.661 bln
+995.476 mln
0.32%
jan 1, 2015
315.031 bln
+7.37 bln
2.4%
jan 1, 2016
325.113 bln
+10.082 bln
3.2%
Ranking of countries by current statistics by years


Comments: