29
/
en
AIzaSyAYiBZKx7MnpbEhh9jyipgxe19OcubqV5w
April 1, 2024
259681
Tajikistan
TJK
true
2
1
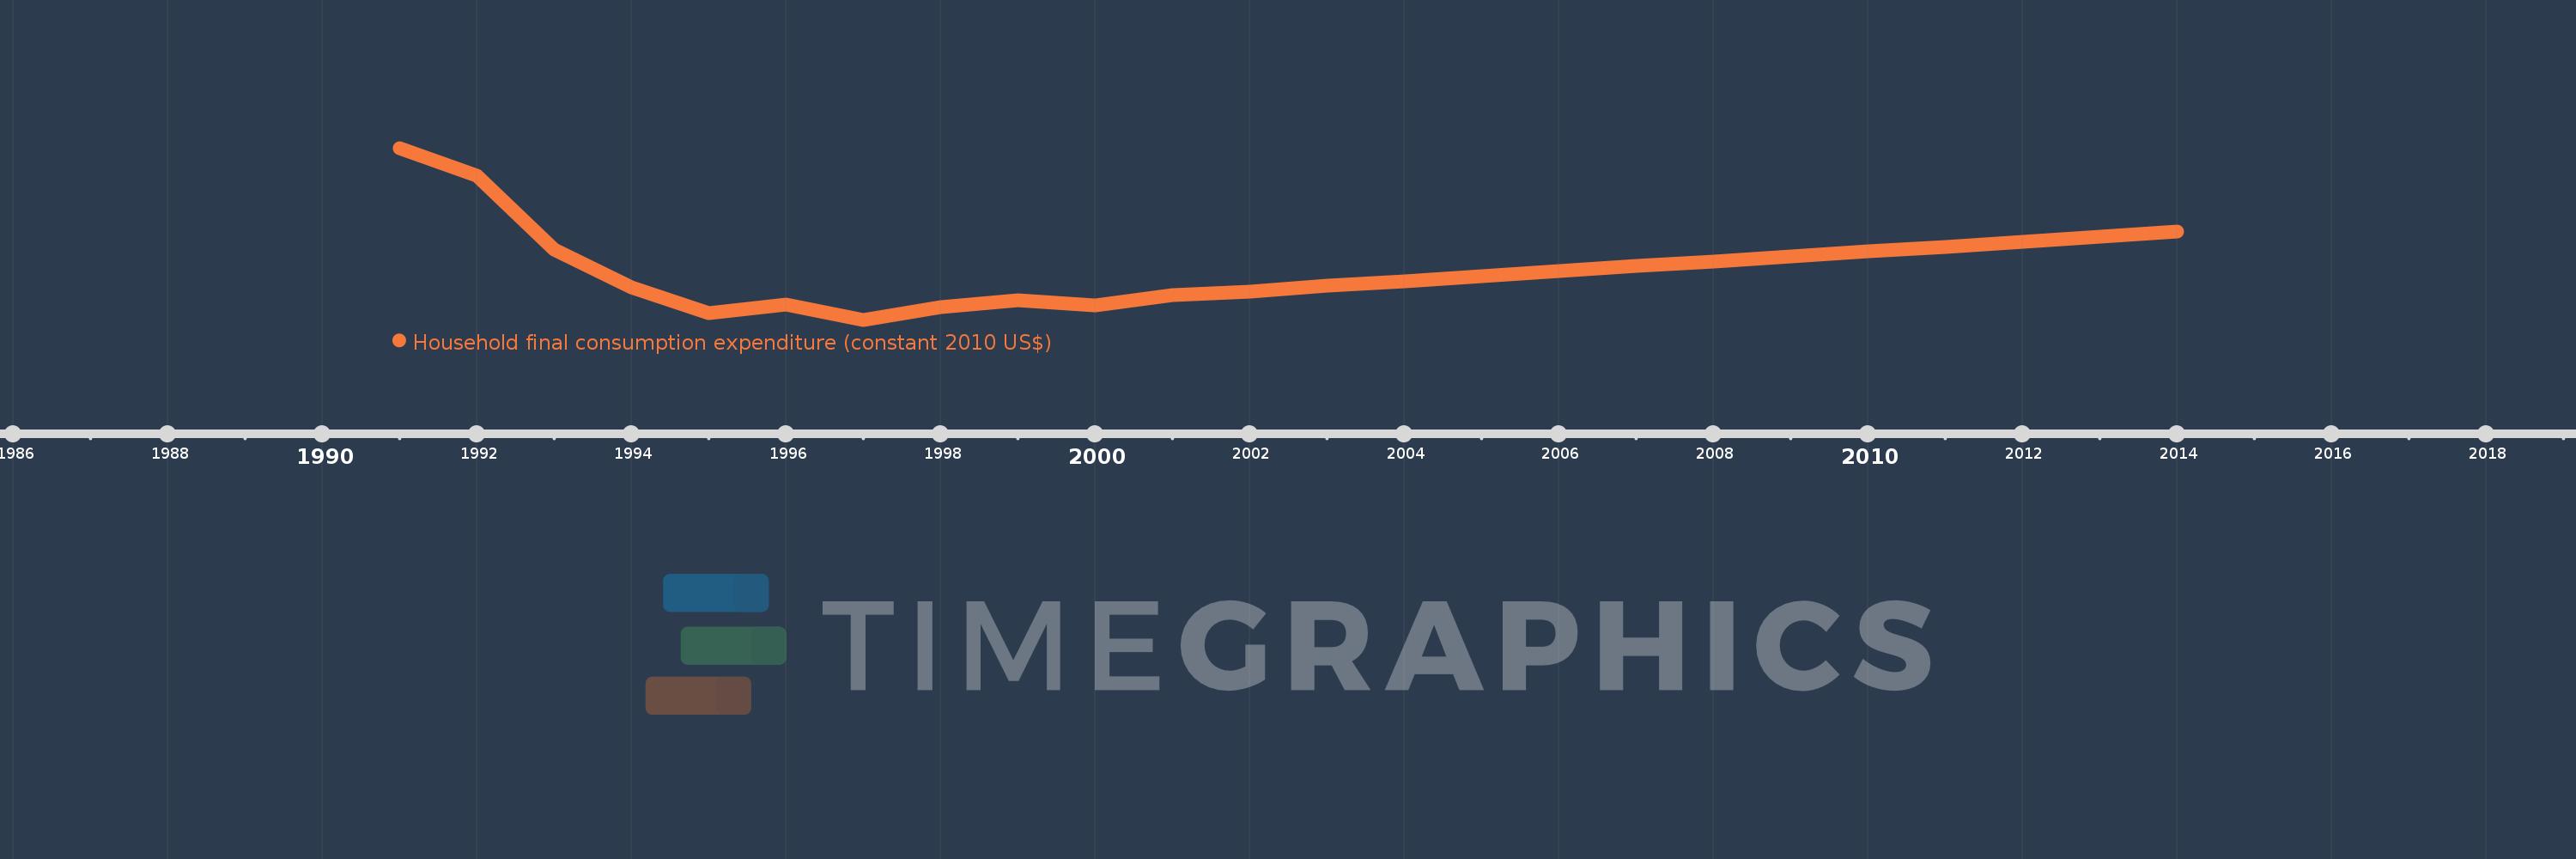
Household final consumption expenditure (constant 2010 US$)
2014,2013,2012,2011,2010,2009,2008,2007,2006,2005,2004,2003,2002,2001,2000,1999,1998,1997,1996,1995,1994,1993,1992,1991
This statistics in other country:
AfghanistanAlbaniaAlgeriaAngolaAntigua and BarbudaArab WorldArgentinaArmeniaArubaAustraliaAustriaAzerbaijanBahamas, TheBahrainBangladeshBarbadosBelarusBelgiumBelizeBeninBermudaBhutanBoliviaBosnia and HerzegovinaBotswanaBrazilBrunei DarussalamBulgariaBurkina FasoBurundiCabo VerdeCambodiaCameroonCanadaCaribbean small statesCentral African RepublicCentral Europe and the BalticsChadChileChinaColombiaComorosCongo, Dem. Rep.Congo, Rep.Costa RicaCote d'IvoireCroatiaCubaCyprusCzech RepublicDenmarkDominicaDominican RepublicEarly-demographic dividendEast Asia & PacificEast Asia & Pacific (excluding high income)East Asia & Pacific (IDA & IBRD countries)EcuadorEgypt, Arab Rep.El SalvadorEquatorial GuineaEritreaEstoniaEuro areaEurope & Central AsiaEurope & Central Asia (excluding high income)Europe & Central Asia (IDA & IBRD countries)European UnionFaroe IslandsFinlandFranceGabonGambia, TheGeorgiaGermanyGhanaGreeceGrenadaGuatemalaGuineaGuinea-BissauGuyanaHaitiHeavily indebted poor countries (HIPC)High incomeHondurasHong Kong SAR, ChinaHungaryIBRD onlyIcelandIDA & IBRD totalIDA blendIDA onlyIDA totalIndiaIndonesiaIran, Islamic Rep.IrelandIsraelItalyJamaicaJapanJordanKazakhstanKenyaKorea, Rep.KosovoKuwaitKyrgyz RepublicLao PDRLate-demographic dividendLatin America & Caribbean Latin America & Caribbean (excluding high income)Latin America & the Caribbean (IDA & IBRD countries)LatviaLeast developed countries: UN classificationLebanonLiberiaLithuaniaLow & middle incomeLow incomeLower middle incomeLuxembourgMacao SAR, ChinaMacedonia, FYRMadagascarMalawiMalaysiaMaliMaltaMauritaniaMauritiusMexicoMiddle East & North AfricaMiddle East & North Africa (excluding high income)Middle East & North Africa (IDA & IBRD countries)Middle incomeMoldovaMongoliaMontenegroMoroccoMozambiqueNamibiaNepalNetherlandsNew ZealandNicaraguaNigerNigeriaNorth AmericaNorwayOECD membersOmanOther small statesPakistanPanamaParaguayPeruPhilippinesPolandPortugalPost-demographic dividendPre-demographic dividendPuerto RicoQatarRomaniaRussian FederationRwandaSaudi ArabiaSenegalSerbiaSeychellesSierra LeoneSingaporeSlovak RepublicSloveniaSmall statesSouth AfricaSouth AsiaSouth Asia (IDA & IBRD)South SudanSpainSri LankaSt. Kitts and NevisSt. LuciaSt. Vincent and the GrenadinesSub-Saharan Africa Sub-Saharan Africa (excluding high income)Sub-Saharan Africa (IDA & IBRD countries)SudanSurinameSwazilandSwedenSwitzerlandTajikistanTanzaniaThailandTimor-LesteTogoTongaTrinidad and TobagoTunisiaTurkeyTurkmenistanUgandaUkraineUnited Arab EmiratesUnited KingdomUnited StatesUpper middle incomeUruguayUzbekistanVanuatuVenezuela, RBVietnamWest Bank and GazaWorldYemen, Rep.ZambiaZimbabwe Timeline:
This timeline shows a graph from 1991 to 2014 of Tajikistan. No data until 1990. Number of actual observations by date: 24.
Source name:
World Development Indicators
Source organization:
World Bank national accounts data, and OECD National Accounts data files.
Categories, topics:
Economy & Growth
Last updated:
apr 23, 2017
Indicators value changes by year
Minimum:
1.603 bln
jan 1, 1997
Maximum:
8.951 bln
jan 1, 1991
At the date of observation
Value
Absolute change
Change from previous value
jan 1, 1991
8.951 bln
+8.951 bln
0.0%
jan 1, 1992
7.78 bln
-1.171 bln
-13.08%
jan 1, 1993
4.619 bln
-3.161 bln
-40.63%
jan 1, 1994
2.979 bln
-1.64 bln
-35.5%
jan 1, 1995
1.886 bln
-1.094 bln
-36.71%
jan 1, 1996
2.27 bln
+384.61 mln
20.4%
jan 1, 1997
1.603 bln
-667.39 mln
-29.4%
jan 1, 1998
2.137 bln
+533.542 mln
33.28%
jan 1, 1999
2.448 bln
+311.032 mln
14.56%
jan 1, 2000
2.222 bln
-225.644 mln
-9.22%
jan 1, 2001
2.673 bln
+450.627 mln
20.28%
jan 1, 2002
2.798 bln
+125.614 mln
4.7%
jan 1, 2003
3.049 bln
+250.95 mln
8.97%
jan 1, 2004
3.259 bln
+210.236 mln
6.89%
jan 1, 2005
3.47 bln
+210.236 mln
6.45%
jan 1, 2006
3.68 bln
+210.236 mln
6.06%
jan 1, 2007
3.89 bln
+210.236 mln
5.71%
jan 1, 2008
4.1 bln
+210.236 mln
5.4%
jan 1, 2009
4.311 bln
+210.236 mln
5.13%
jan 1, 2010
4.521 bln
+210.236 mln
4.88%
jan 1, 2011
4.731 bln
+210.236 mln
4.65%
jan 1, 2012
4.941 bln
+210.236 mln
4.44%
jan 1, 2013
5.151 bln
+210.236 mln
4.25%
jan 1, 2014
5.362 bln
+210.236 mln
4.08%
Ranking of countries by current statistics by years


Comments: