29
/
en
AIzaSyAYiBZKx7MnpbEhh9jyipgxe19OcubqV5w
April 1, 2024
257399
Switzerland
CHE
true
2
1
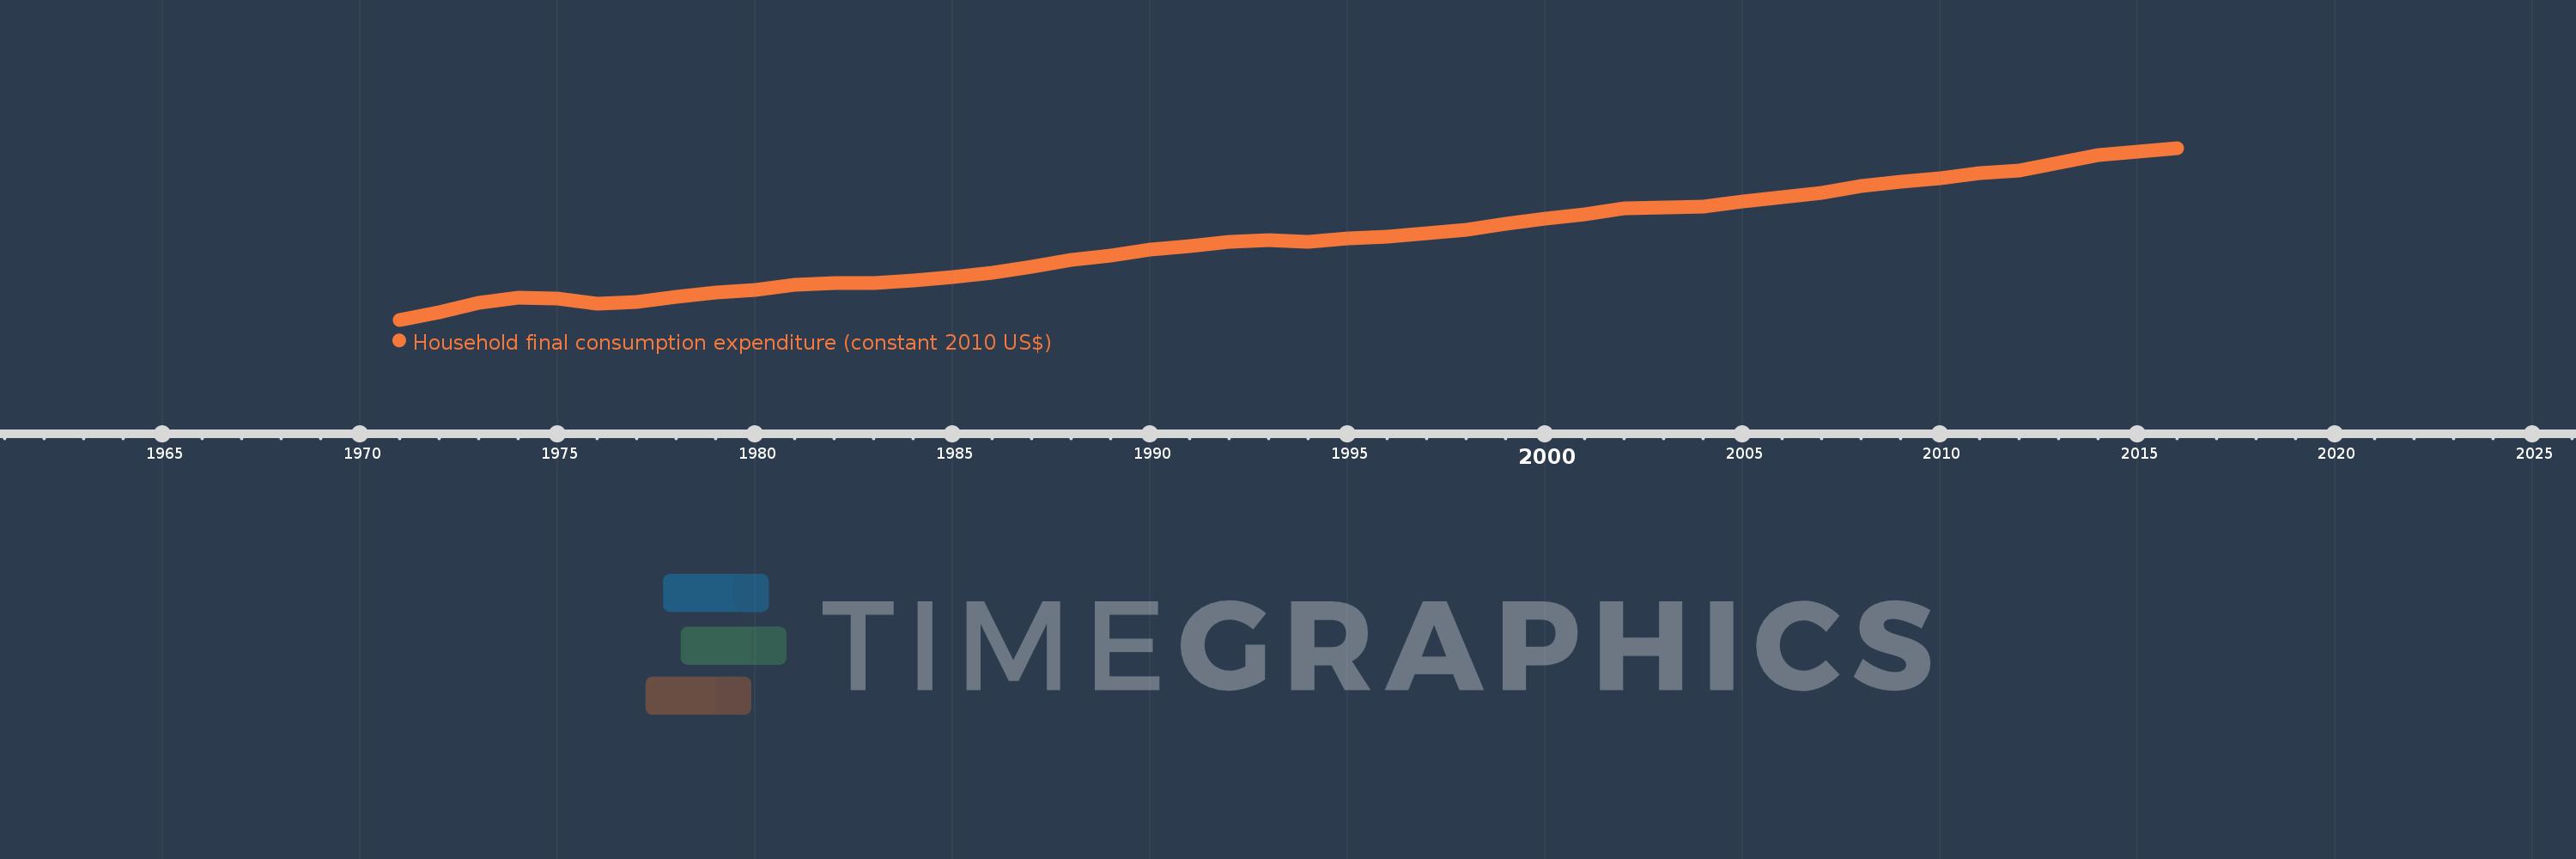
Household final consumption expenditure (constant 2010 US$)
2016,2015,2014,2013,2012,2011,2010,2009,2008,2007,2006,2005,2004,2003,2002,2001,2000,1999,1998,1997,1996,1995,1994,1993,1992,1991,1990,1989,1988,1987,1986,1985,1984,1983,1982,1981,1980,1979,1978,1977,1976,1975,1974,1973,1972,1971
This statistics in other country:
AfghanistanAlbaniaAlgeriaAngolaAntigua and BarbudaArab WorldArgentinaArmeniaArubaAustraliaAustriaAzerbaijanBahamas, TheBahrainBangladeshBarbadosBelarusBelgiumBelizeBeninBermudaBhutanBoliviaBosnia and HerzegovinaBotswanaBrazilBrunei DarussalamBulgariaBurkina FasoBurundiCabo VerdeCambodiaCameroonCanadaCaribbean small statesCentral African RepublicCentral Europe and the BalticsChadChileChinaColombiaComorosCongo, Dem. Rep.Congo, Rep.Costa RicaCote d'IvoireCroatiaCubaCyprusCzech RepublicDenmarkDominicaDominican RepublicEarly-demographic dividendEast Asia & PacificEast Asia & Pacific (excluding high income)East Asia & Pacific (IDA & IBRD countries)EcuadorEgypt, Arab Rep.El SalvadorEquatorial GuineaEritreaEstoniaEuro areaEurope & Central AsiaEurope & Central Asia (excluding high income)Europe & Central Asia (IDA & IBRD countries)European UnionFaroe IslandsFinlandFranceGabonGambia, TheGeorgiaGermanyGhanaGreeceGrenadaGuatemalaGuineaGuinea-BissauGuyanaHaitiHeavily indebted poor countries (HIPC)High incomeHondurasHong Kong SAR, ChinaHungaryIBRD onlyIcelandIDA & IBRD totalIDA blendIDA onlyIDA totalIndiaIndonesiaIran, Islamic Rep.IrelandIsraelItalyJamaicaJapanJordanKazakhstanKenyaKorea, Rep.KosovoKuwaitKyrgyz RepublicLao PDRLate-demographic dividendLatin America & Caribbean Latin America & Caribbean (excluding high income)Latin America & the Caribbean (IDA & IBRD countries)LatviaLeast developed countries: UN classificationLebanonLiberiaLithuaniaLow & middle incomeLow incomeLower middle incomeLuxembourgMacao SAR, ChinaMacedonia, FYRMadagascarMalawiMalaysiaMaliMaltaMauritaniaMauritiusMexicoMiddle East & North AfricaMiddle East & North Africa (excluding high income)Middle East & North Africa (IDA & IBRD countries)Middle incomeMoldovaMongoliaMontenegroMoroccoMozambiqueNamibiaNepalNetherlandsNew ZealandNicaraguaNigerNigeriaNorth AmericaNorwayOECD membersOmanOther small statesPakistanPanamaParaguayPeruPhilippinesPolandPortugalPost-demographic dividendPre-demographic dividendPuerto RicoQatarRomaniaRussian FederationRwandaSaudi ArabiaSenegalSerbiaSeychellesSierra LeoneSingaporeSlovak RepublicSloveniaSmall statesSouth AfricaSouth AsiaSouth Asia (IDA & IBRD)South SudanSpainSri LankaSt. Kitts and NevisSt. LuciaSt. Vincent and the GrenadinesSub-Saharan Africa Sub-Saharan Africa (excluding high income)Sub-Saharan Africa (IDA & IBRD countries)SudanSurinameSwazilandSwedenSwitzerlandTajikistanTanzaniaThailandTimor-LesteTogoTongaTrinidad and TobagoTunisiaTurkeyTurkmenistanUgandaUkraineUnited Arab EmiratesUnited KingdomUnited StatesUpper middle incomeUruguayUzbekistanVanuatuVenezuela, RBVietnamWest Bank and GazaWorldYemen, Rep.ZambiaZimbabwe Timeline:
This timeline shows a graph from 1971 to 2016 of Switzerland. No data until 1970. Number of actual observations by date: 46.
Source name:
World Development Indicators
Source organization:
World Bank national accounts data, and OECD National Accounts data files.
Categories, topics:
Economy & Growth
Last updated:
apr 23, 2017
Indicators value changes by year
Minimum:
166.767 bln
jan 1, 1971
Maximum:
342.77 bln
jan 1, 2016
At the date of observation
Value
Absolute change
Change from previous value
jan 1, 1971
166.767 bln
+166.767 bln
0.0%
jan 1, 1972
174.706 bln
+7.94 bln
4.76%
jan 1, 1973
184.206 bln
+9.5 bln
5.44%
jan 1, 1974
189.291 bln
+5.085 bln
2.76%
jan 1, 1975
188.371 bln
-920.328 mln
-0.49%
jan 1, 1976
182.864 bln
-5.506 bln
-2.92%
jan 1, 1977
184.814 bln
+1.95 bln
1.07%
jan 1, 1978
190.414 bln
+5.6 bln
3.03%
jan 1, 1979
194.642 bln
+4.227 bln
2.22%
jan 1, 1980
197.122 bln
+2.48 bln
1.27%
jan 1, 1981
202.301 bln
+5.179 bln
2.63%
jan 1, 1982
204.249 bln
+1.948 bln
0.96%
jan 1, 1983
204.764 bln
+514.94 mln
0.25%
jan 1, 1984
207.34 bln
+2.577 bln
1.26%
jan 1, 1985
210.699 bln
+3.358 bln
1.62%
jan 1, 1986
215.199 bln
+4.5 bln
2.14%
jan 1, 1987
221.227 bln
+6.029 bln
2.8%
jan 1, 1988
227.85 bln
+6.622 bln
2.99%
jan 1, 1989
232.713 bln
+4.863 bln
2.13%
jan 1, 1990
238.596 bln
+5.882 bln
2.53%
jan 1, 1991
242.359 bln
+3.763 bln
1.58%
jan 1, 1992
246.771 bln
+4.412 bln
1.82%
jan 1, 1993
247.928 bln
+1.157 bln
0.47%
jan 1, 1994
247.007 bln
-921.119 mln
-0.37%
jan 1, 1995
250.019 bln
+3.012 bln
1.22%
jan 1, 1996
252.226 bln
+2.207 bln
0.88%
jan 1, 1997
254.957 bln
+2.732 bln
1.08%
jan 1, 1998
259.085 bln
+4.127 bln
1.62%
jan 1, 1999
264.69 bln
+5.605 bln
2.16%
jan 1, 2000
270.048 bln
+5.358 bln
2.02%
jan 1, 2001
274.823 bln
+4.775 bln
1.77%
jan 1, 2002
280.676 bln
+5.854 bln
2.13%
jan 1, 2003
281.607 bln
+930.693 mln
0.33%
jan 1, 2004
282.808 bln
+1.201 bln
0.43%
jan 1, 2005
287.939 bln
+5.131 bln
1.81%
jan 1, 2006
292.198 bln
+4.258 bln
1.48%
jan 1, 2007
296.526 bln
+4.328 bln
1.48%
jan 1, 2008
303.443 bln
+6.917 bln
2.33%
jan 1, 2009
308.033 bln
+4.59 bln
1.51%
jan 1, 2010
311.901 bln
+3.868 bln
1.26%
jan 1, 2011
316.993 bln
+5.092 bln
1.63%
jan 1, 2012
319.584 bln
+2.591 bln
0.82%
jan 1, 2013
327.905 bln
+8.321 bln
2.6%
jan 1, 2014
335.127 bln
+7.222 bln
2.2%
jan 1, 2015
339.202 bln
+4.075 bln
1.22%
jan 1, 2016
342.77 bln
+3.568 bln
1.05%
Ranking of countries by current statistics by years


Comments: