29
/
en
AIzaSyAYiBZKx7MnpbEhh9jyipgxe19OcubqV5w
April 1, 2024
194321
Mauritius
MUS
true
2
1
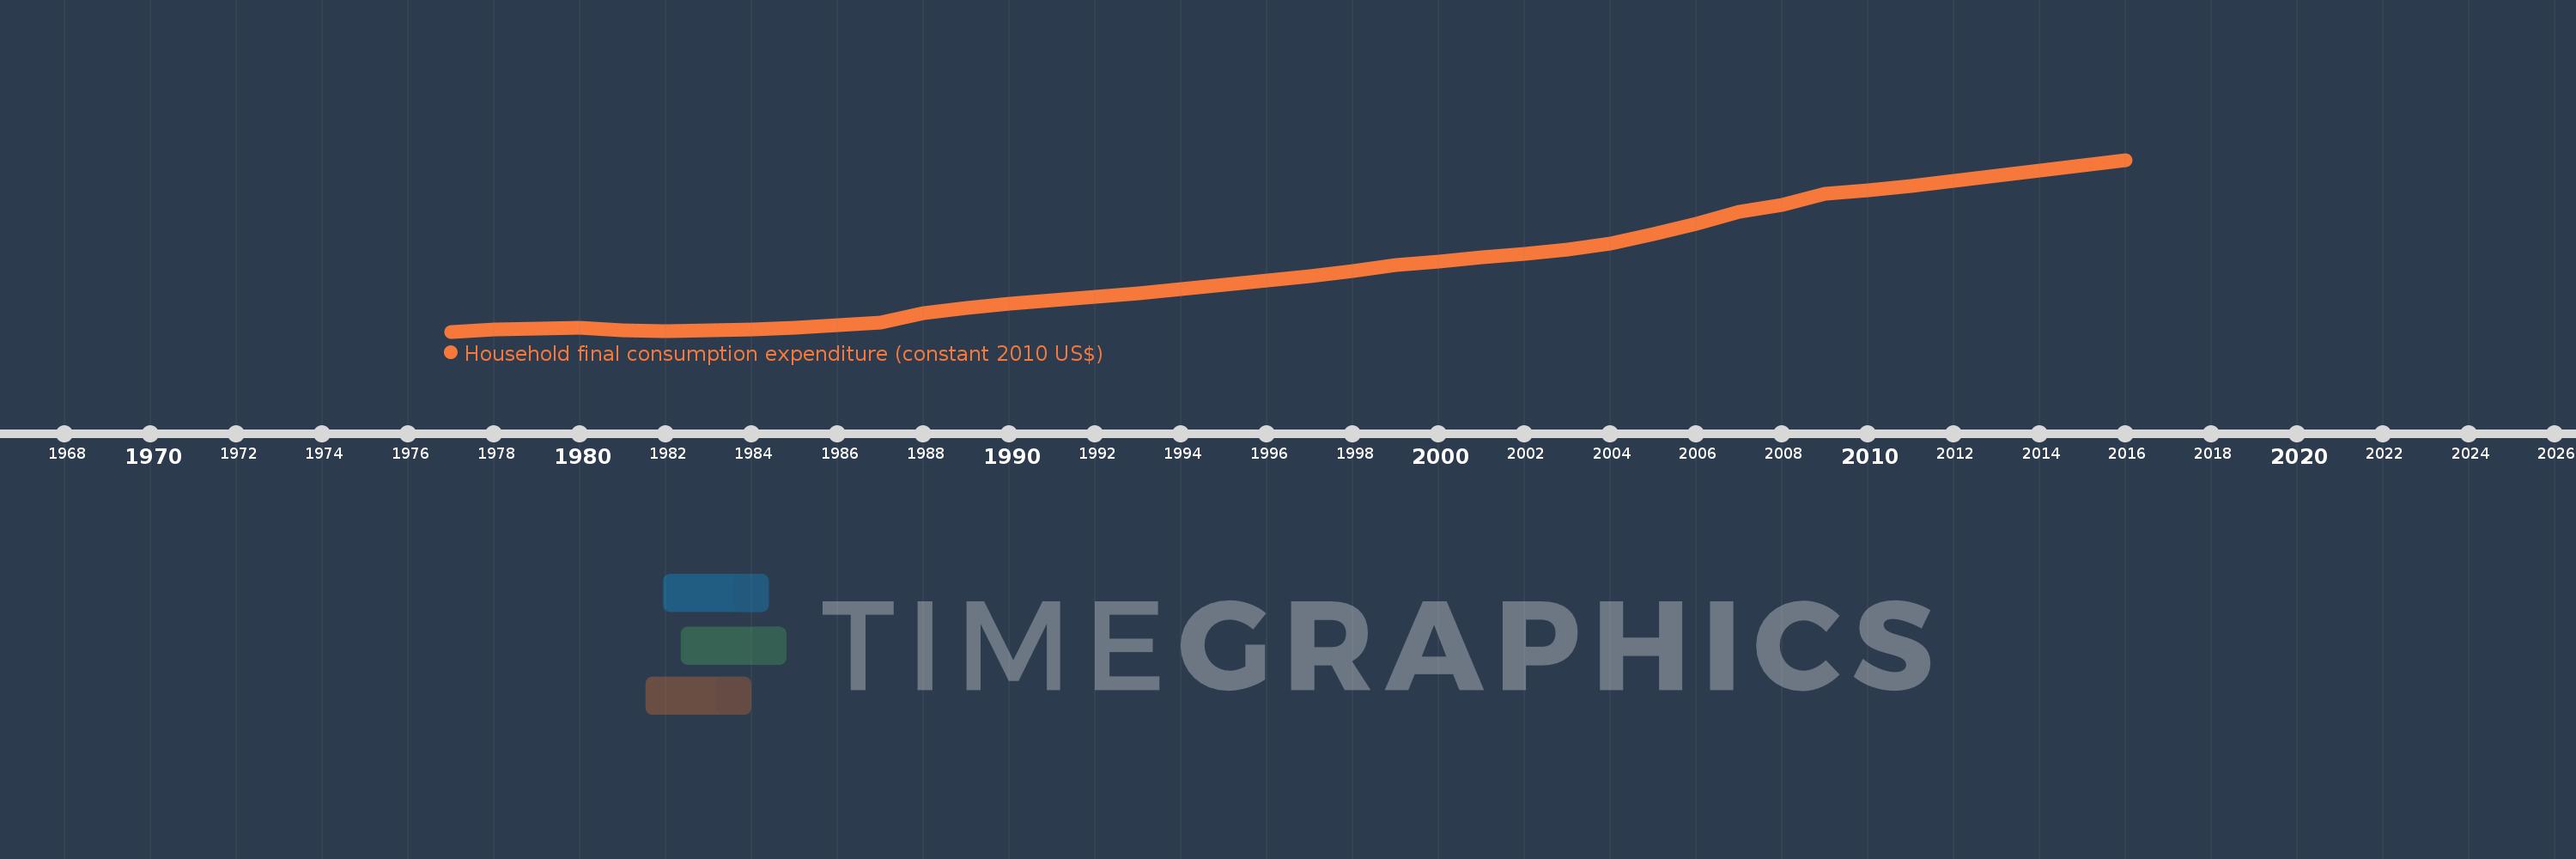
Household final consumption expenditure (constant 2010 US$)
2016,2015,2014,2013,2012,2011,2010,2009,2008,2007,2006,2005,2004,2003,2002,2001,2000,1999,1998,1997,1996,1995,1994,1993,1992,1991,1990,1989,1988,1987,1986,1985,1984,1983,1982,1981,1980,1979,1978,1977
This statistics in other country:
AfghanistanAlbaniaAlgeriaAngolaAntigua and BarbudaArab WorldArgentinaArmeniaArubaAustraliaAustriaAzerbaijanBahamas, TheBahrainBangladeshBarbadosBelarusBelgiumBelizeBeninBermudaBhutanBoliviaBosnia and HerzegovinaBotswanaBrazilBrunei DarussalamBulgariaBurkina FasoBurundiCabo VerdeCambodiaCameroonCanadaCaribbean small statesCentral African RepublicCentral Europe and the BalticsChadChileChinaColombiaComorosCongo, Dem. Rep.Congo, Rep.Costa RicaCote d'IvoireCroatiaCubaCyprusCzech RepublicDenmarkDominicaDominican RepublicEarly-demographic dividendEast Asia & PacificEast Asia & Pacific (excluding high income)East Asia & Pacific (IDA & IBRD countries)EcuadorEgypt, Arab Rep.El SalvadorEquatorial GuineaEritreaEstoniaEuro areaEurope & Central AsiaEurope & Central Asia (excluding high income)Europe & Central Asia (IDA & IBRD countries)European UnionFaroe IslandsFinlandFranceGabonGambia, TheGeorgiaGermanyGhanaGreeceGrenadaGuatemalaGuineaGuinea-BissauGuyanaHaitiHeavily indebted poor countries (HIPC)High incomeHondurasHong Kong SAR, ChinaHungaryIBRD onlyIcelandIDA & IBRD totalIDA blendIDA onlyIDA totalIndiaIndonesiaIran, Islamic Rep.IrelandIsraelItalyJamaicaJapanJordanKazakhstanKenyaKorea, Rep.KosovoKuwaitKyrgyz RepublicLao PDRLate-demographic dividendLatin America & Caribbean Latin America & Caribbean (excluding high income)Latin America & the Caribbean (IDA & IBRD countries)LatviaLeast developed countries: UN classificationLebanonLiberiaLithuaniaLow & middle incomeLow incomeLower middle incomeLuxembourgMacao SAR, ChinaMacedonia, FYRMadagascarMalawiMalaysiaMaliMaltaMauritaniaMauritiusMexicoMiddle East & North AfricaMiddle East & North Africa (excluding high income)Middle East & North Africa (IDA & IBRD countries)Middle incomeMoldovaMongoliaMontenegroMoroccoMozambiqueNamibiaNepalNetherlandsNew ZealandNicaraguaNigerNigeriaNorth AmericaNorwayOECD membersOmanOther small statesPakistanPanamaParaguayPeruPhilippinesPolandPortugalPost-demographic dividendPre-demographic dividendPuerto RicoQatarRomaniaRussian FederationRwandaSaudi ArabiaSenegalSerbiaSeychellesSierra LeoneSingaporeSlovak RepublicSloveniaSmall statesSouth AfricaSouth AsiaSouth Asia (IDA & IBRD)South SudanSpainSri LankaSt. Kitts and NevisSt. LuciaSt. Vincent and the GrenadinesSub-Saharan Africa Sub-Saharan Africa (excluding high income)Sub-Saharan Africa (IDA & IBRD countries)SudanSurinameSwazilandSwedenSwitzerlandTajikistanTanzaniaThailandTimor-LesteTogoTongaTrinidad and TobagoTunisiaTurkeyTurkmenistanUgandaUkraineUnited Arab EmiratesUnited KingdomUnited StatesUpper middle incomeUruguayUzbekistanVanuatuVenezuela, RBVietnamWest Bank and GazaWorldYemen, Rep.ZambiaZimbabwe Timeline:
This timeline shows a graph from 1977 to 2016 of Mauritius. No data until 1976. Number of actual observations by date: 40.
Source name:
World Development Indicators
Source organization:
World Bank national accounts data, and OECD National Accounts data files.
Categories, topics:
Economy & Growth
Last updated:
apr 23, 2017
Indicators value changes by year
Minimum:
1.504 bln
jan 1, 1977
Maximum:
8.356 bln
jan 1, 2016
At the date of observation
Value
Absolute change
Change from previous value
jan 1, 1977
1.504 bln
+1.504 bln
0.0%
jan 1, 1978
1.595 bln
+90.996 mln
6.05%
jan 1, 1979
1.641 bln
+45.498 mln
2.85%
jan 1, 1980
1.656 bln
+15.336 mln
0.93%
jan 1, 1981
1.564 bln
-92.53 mln
-5.59%
jan 1, 1982
1.516 bln
-48.054 mln
-3.07%
jan 1, 1983
1.57 bln
+54.189 mln
3.58%
jan 1, 1984
1.601 bln
+30.638 mln
1.95%
jan 1, 1985
1.673 bln
+72.057 mln
4.5%
jan 1, 1986
1.758 bln
+85.296 mln
5.1%
jan 1, 1987
1.881 bln
+122.932 mln
6.99%
jan 1, 1988
2.251 bln
+370.498 mln
19.7%
jan 1, 1989
2.445 bln
+193.564 mln
8.6%
jan 1, 1990
2.621 bln
+176.093 mln
7.2%
jan 1, 1991
2.752 bln
+131.035 mln
5.0%
jan 1, 1992
2.891 bln
+138.951 mln
5.05%
jan 1, 1993
3.03 bln
+139.116 mln
4.81%
jan 1, 1994
3.192 bln
+161.937 mln
5.34%
jan 1, 1995
3.379 bln
+186.561 mln
5.84%
jan 1, 1996
3.54 bln
+161.615 mln
4.78%
jan 1, 1997
3.715 bln
+174.491 mln
4.93%
jan 1, 1998
3.904 bln
+189.273 mln
5.1%
jan 1, 1999
4.145 bln
+240.518 mln
6.16%
jan 1, 2000
4.313 bln
+168.408 mln
4.06%
jan 1, 2001
4.475 bln
+161.887 mln
3.75%
jan 1, 2002
4.618 bln
+143.583 mln
3.21%
jan 1, 2003
4.77 bln
+151.896 mln
3.29%
jan 1, 2004
5.009 bln
+239.178 mln
5.01%
jan 1, 2005
5.398 bln
+388.163 mln
7.75%
jan 1, 2006
5.791 bln
+393.127 mln
7.28%
jan 1, 2007
6.269 bln
+477.872 mln
8.25%
jan 1, 2008
6.548 bln
+279.7 mln
4.46%
jan 1, 2009
6.988 bln
+439.309 mln
6.71%
jan 1, 2010
7.134 bln
+146.06 mln
2.09%
jan 1, 2011
7.322 bln
+188.066 mln
2.64%
jan 1, 2012
7.505 bln
+183.381 mln
2.5%
jan 1, 2013
7.711 bln
+205.703 mln
2.74%
jan 1, 2014
7.914 bln
+203.436 mln
2.64%
jan 1, 2015
8.122 bln
+208.146 mln
2.63%
jan 1, 2016
8.356 bln
+233.232 mln
2.87%
Ranking of countries by current statistics by years


Comments: