29
/
en
AIzaSyAYiBZKx7MnpbEhh9jyipgxe19OcubqV5w
April 1, 2024
31655
Europe & Central Asia (excluding high income)
ECA
false
2
1
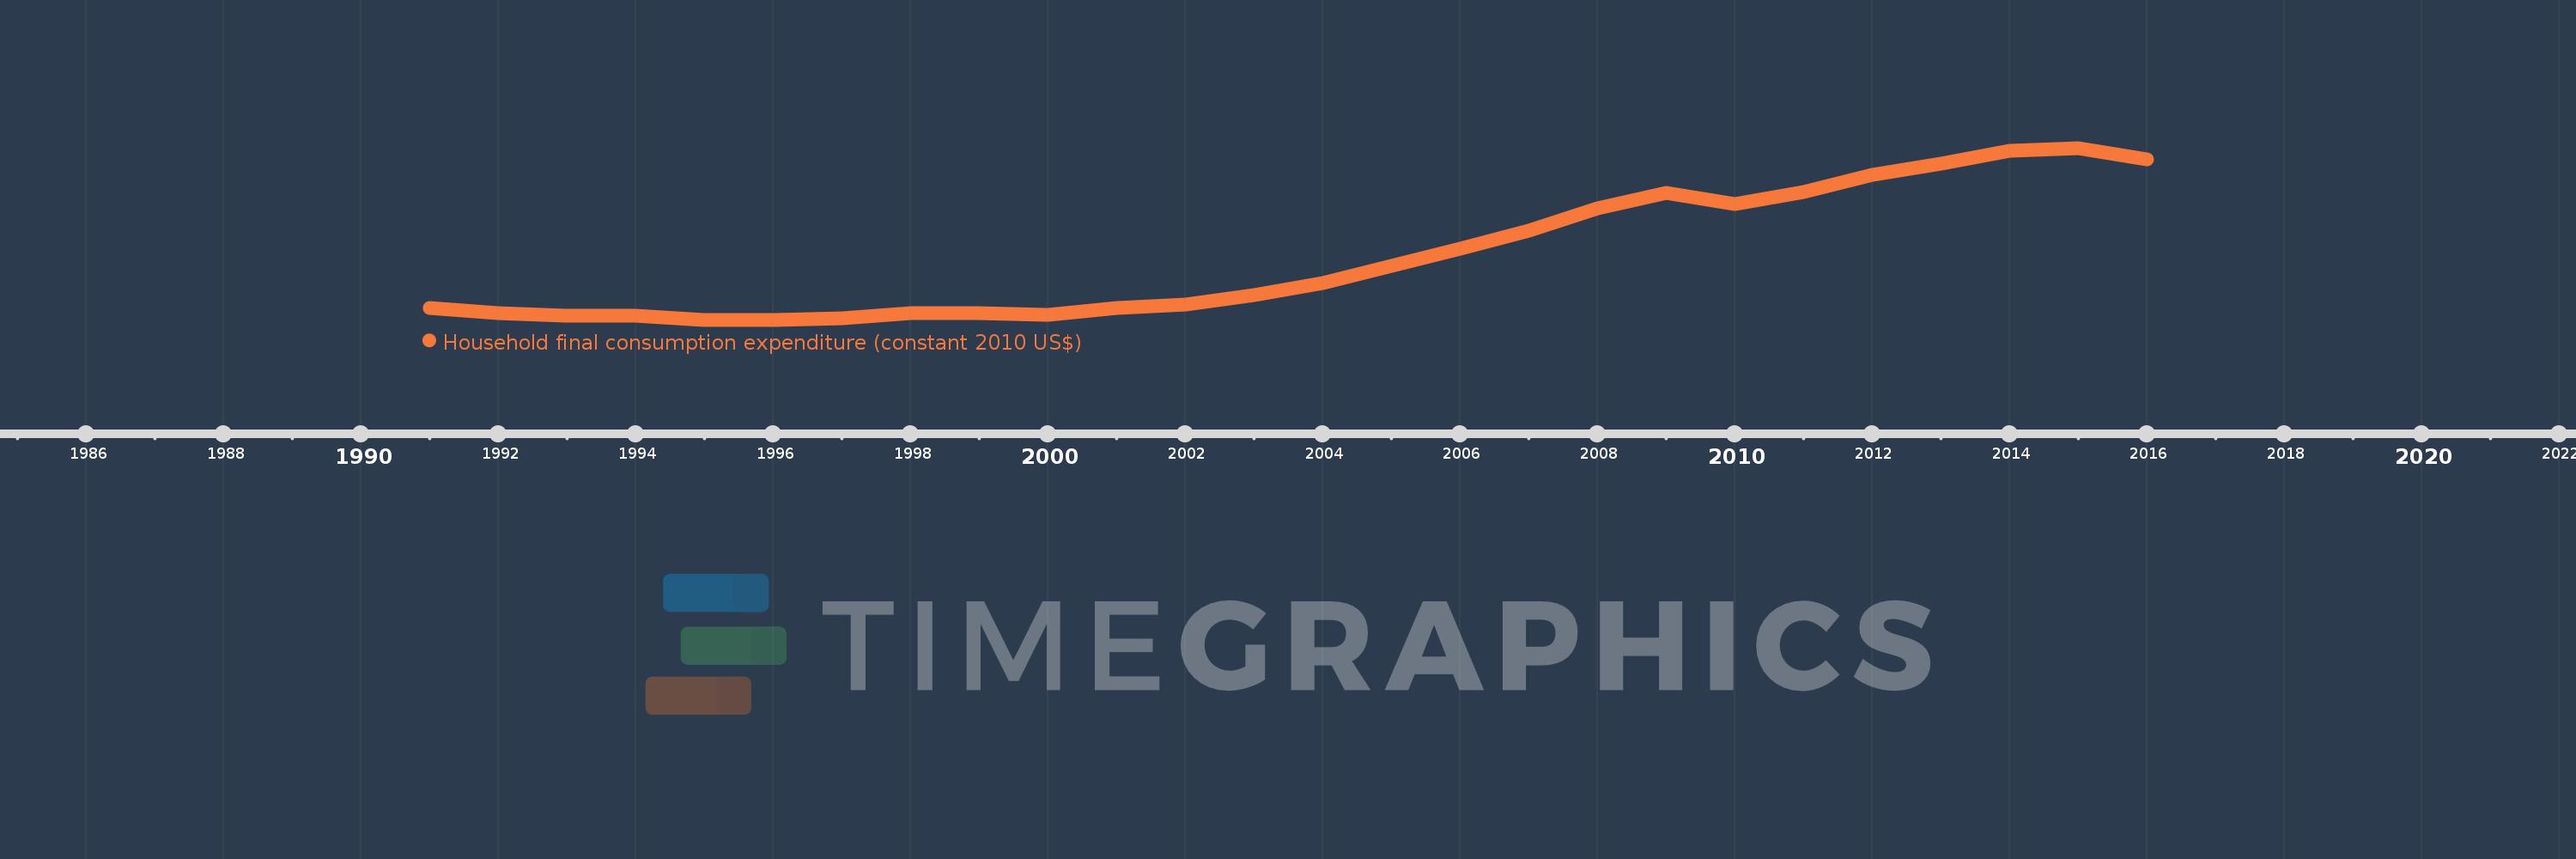
Household final consumption expenditure (constant 2010 US$)
2016,2015,2014,2013,2012,2011,2010,2009,2008,2007,2006,2005,2004,2003,2002,2001,2000,1999,1998,1997,1996,1995,1994,1993,1992,1991
This statistics in other country:
AfghanistanAlbaniaAlgeriaAngolaAntigua and BarbudaArab WorldArgentinaArmeniaArubaAustraliaAustriaAzerbaijanBahamas, TheBahrainBangladeshBarbadosBelarusBelgiumBelizeBeninBermudaBhutanBoliviaBosnia and HerzegovinaBotswanaBrazilBrunei DarussalamBulgariaBurkina FasoBurundiCabo VerdeCambodiaCameroonCanadaCaribbean small statesCentral African RepublicCentral Europe and the BalticsChadChileChinaColombiaComorosCongo, Dem. Rep.Congo, Rep.Costa RicaCote d'IvoireCroatiaCubaCyprusCzech RepublicDenmarkDominicaDominican RepublicEarly-demographic dividendEast Asia & PacificEast Asia & Pacific (excluding high income)East Asia & Pacific (IDA & IBRD countries)EcuadorEgypt, Arab Rep.El SalvadorEquatorial GuineaEritreaEstoniaEuro areaEurope & Central AsiaEurope & Central Asia (excluding high income)Europe & Central Asia (IDA & IBRD countries)European UnionFaroe IslandsFinlandFranceGabonGambia, TheGeorgiaGermanyGhanaGreeceGrenadaGuatemalaGuineaGuinea-BissauGuyanaHaitiHeavily indebted poor countries (HIPC)High incomeHondurasHong Kong SAR, ChinaHungaryIBRD onlyIcelandIDA & IBRD totalIDA blendIDA onlyIDA totalIndiaIndonesiaIran, Islamic Rep.IrelandIsraelItalyJamaicaJapanJordanKazakhstanKenyaKorea, Rep.KosovoKuwaitKyrgyz RepublicLao PDRLate-demographic dividendLatin America & Caribbean Latin America & Caribbean (excluding high income)Latin America & the Caribbean (IDA & IBRD countries)LatviaLeast developed countries: UN classificationLebanonLiberiaLithuaniaLow & middle incomeLow incomeLower middle incomeLuxembourgMacao SAR, ChinaMacedonia, FYRMadagascarMalawiMalaysiaMaliMaltaMauritaniaMauritiusMexicoMiddle East & North AfricaMiddle East & North Africa (excluding high income)Middle East & North Africa (IDA & IBRD countries)Middle incomeMoldovaMongoliaMontenegroMoroccoMozambiqueNamibiaNepalNetherlandsNew ZealandNicaraguaNigerNigeriaNorth AmericaNorwayOECD membersOmanOther small statesPakistanPanamaParaguayPeruPhilippinesPolandPortugalPost-demographic dividendPre-demographic dividendPuerto RicoQatarRomaniaRussian FederationRwandaSaudi ArabiaSenegalSerbiaSeychellesSierra LeoneSingaporeSlovak RepublicSloveniaSmall statesSouth AfricaSouth AsiaSouth Asia (IDA & IBRD)South SudanSpainSri LankaSt. Kitts and NevisSt. LuciaSt. Vincent and the GrenadinesSub-Saharan Africa Sub-Saharan Africa (excluding high income)Sub-Saharan Africa (IDA & IBRD countries)SudanSurinameSwazilandSwedenSwitzerlandTajikistanTanzaniaThailandTimor-LesteTogoTongaTrinidad and TobagoTunisiaTurkeyTurkmenistanUgandaUkraineUnited Arab EmiratesUnited KingdomUnited StatesUpper middle incomeUruguayUzbekistanVanuatuVenezuela, RBVietnamWest Bank and GazaWorldYemen, Rep.ZambiaZimbabwe Timeline:
This timeline shows a graph from 1991 to 2016 of Europe & Central Asia (excluding high income). No data until 1990. Number of actual observations by date: 26.
Source name:
World Development Indicators
Source organization:
World Bank national accounts data, and OECD National Accounts data files.
Categories, topics:
Economy & Growth
Last updated:
apr 23, 2017
Indicators value changes by year
Minimum:
834.399 bln
jan 1, 1995
Maximum:
2.096 trl
jan 1, 2015
At the date of observation
Value
Absolute change
Change from previous value
jan 1, 1991
921.576 bln
+921.576 bln
0.0%
jan 1, 1992
880.96 bln
-40.616 bln
-4.41%
jan 1, 1993
862.843 bln
-18.118 bln
-2.06%
jan 1, 1994
864.602 bln
+1.759 bln
0.2%
jan 1, 1995
834.399 bln
-30.204 bln
-3.49%
jan 1, 1996
834.781 bln
+382.759 mln
0.05%
jan 1, 1997
843.882 bln
+9.1 bln
1.09%
jan 1, 1998
884.413 bln
+40.531 bln
4.8%
jan 1, 1999
881.978 bln
-2.435 bln
-0.28%
jan 1, 2000
870.611 bln
-11.368 bln
-1.29%
jan 1, 2001
923.81 bln
+53.2 bln
6.11%
jan 1, 2002
948.466 bln
+24.656 bln
2.67%
jan 1, 2003
1.012 trl
+63.939 bln
6.74%
jan 1, 2004
1.102 trl
+89.528 bln
8.84%
jan 1, 2005
1.231 trl
+129.365 bln
11.74%
jan 1, 2006
1.359 trl
+127.861 bln
10.38%
jan 1, 2007
1.491 trl
+131.828 bln
9.7%
jan 1, 2008
1.655 trl
+164.451 bln
11.03%
jan 1, 2009
1.765 trl
+109.321 bln
6.6%
jan 1, 2010
1.684 trl
-81.135 bln
-4.6%
jan 1, 2011
1.773 trl
+89.218 bln
5.3%
jan 1, 2012
1.898 trl
+125.137 bln
7.06%
jan 1, 2013
1.981 trl
+83.237 bln
4.39%
jan 1, 2014
2.073 trl
+91.786 bln
4.63%
jan 1, 2015
2.096 trl
+23.483 bln
1.13%
jan 1, 2016
2.012 trl
-84.841 bln
-4.05%
Ranking of countries by current statistics by years


Comments: