29
/
en
AIzaSyAYiBZKx7MnpbEhh9jyipgxe19OcubqV5w
April 1, 2024
240538
Singapore
SGP
true
2
1
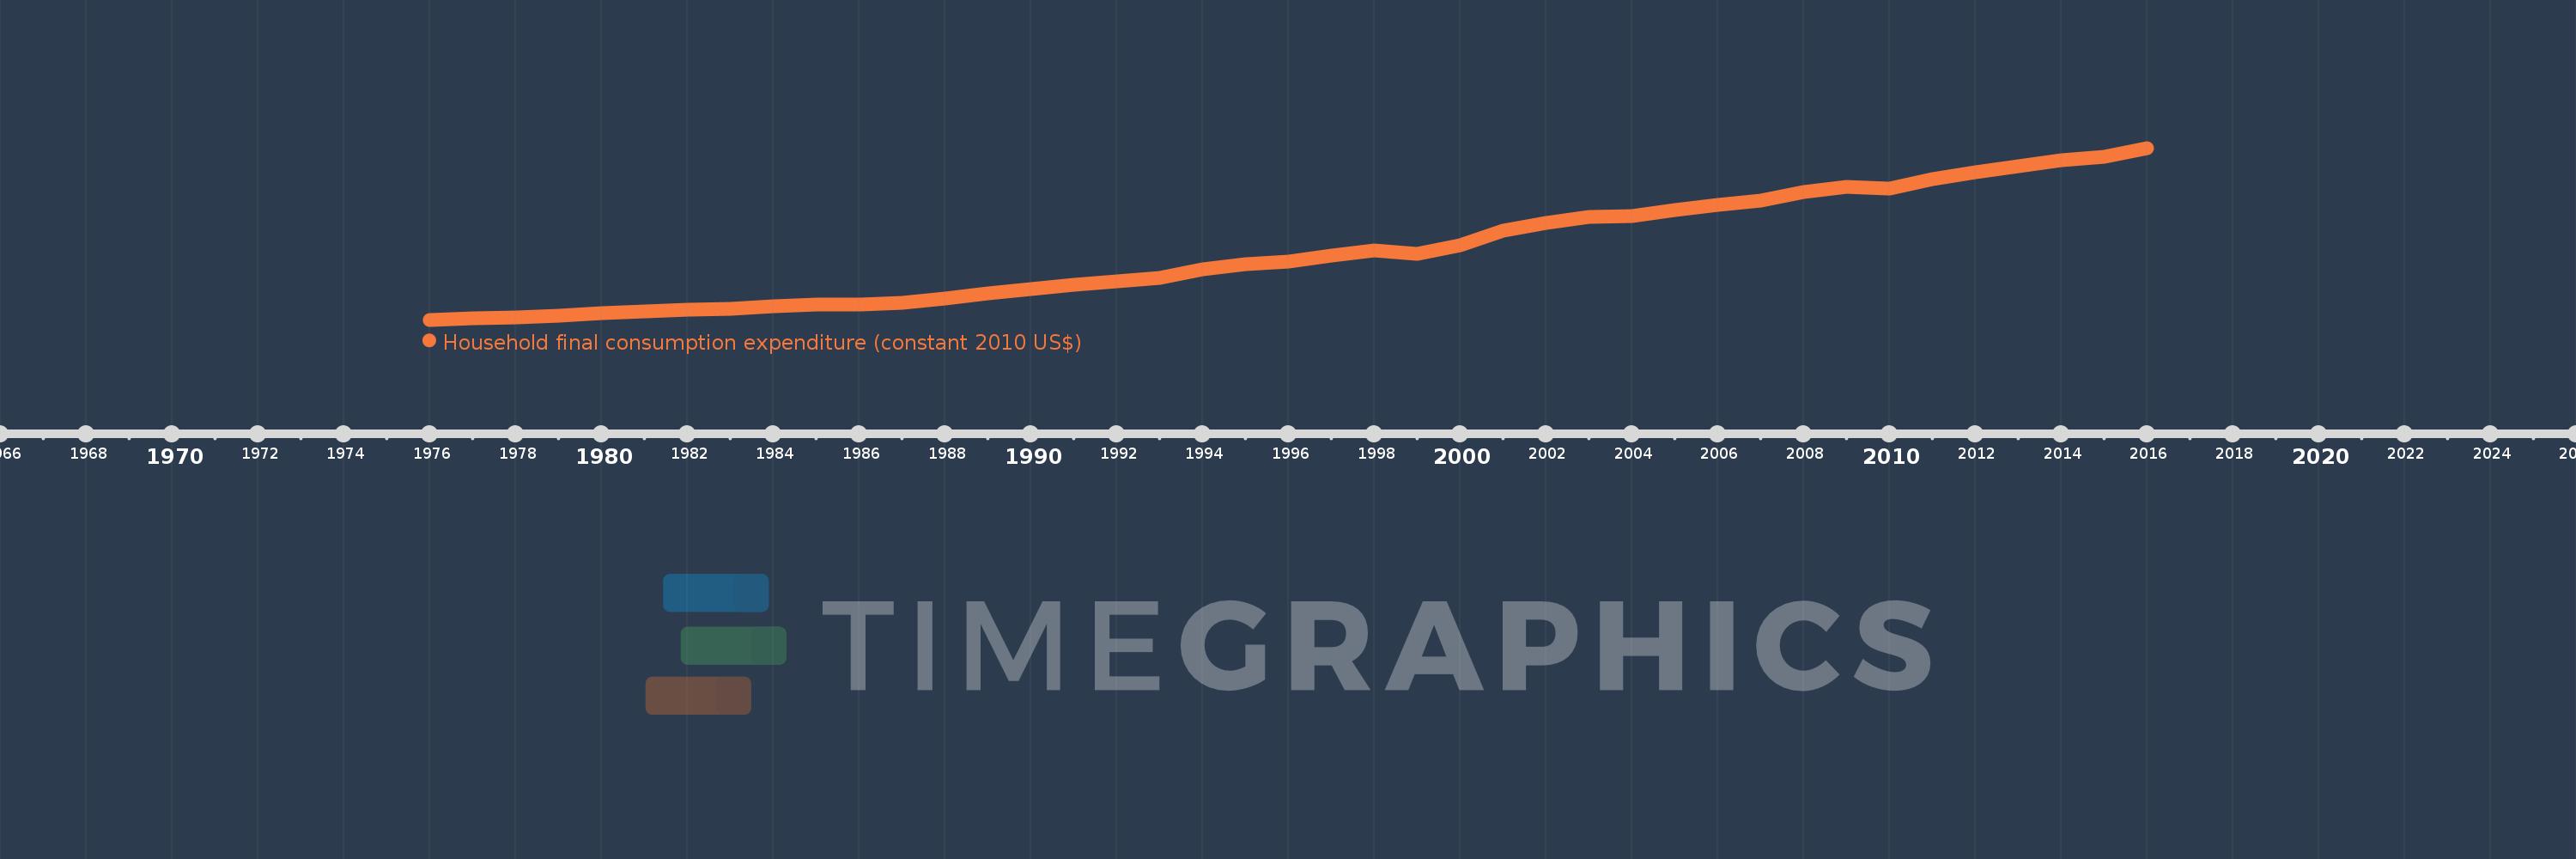
Household final consumption expenditure (constant 2010 US$)
2016,2015,2014,2013,2012,2011,2010,2009,2008,2007,2006,2005,2004,2003,2002,2001,2000,1999,1998,1997,1996,1995,1994,1993,1992,1991,1990,1989,1988,1987,1986,1985,1984,1983,1982,1981,1980,1979,1978,1977,1976
This statistics in other country:
AfghanistanAlbaniaAlgeriaAngolaAntigua and BarbudaArab WorldArgentinaArmeniaArubaAustraliaAustriaAzerbaijanBahamas, TheBahrainBangladeshBarbadosBelarusBelgiumBelizeBeninBermudaBhutanBoliviaBosnia and HerzegovinaBotswanaBrazilBrunei DarussalamBulgariaBurkina FasoBurundiCabo VerdeCambodiaCameroonCanadaCaribbean small statesCentral African RepublicCentral Europe and the BalticsChadChileChinaColombiaComorosCongo, Dem. Rep.Congo, Rep.Costa RicaCote d'IvoireCroatiaCubaCyprusCzech RepublicDenmarkDominicaDominican RepublicEarly-demographic dividendEast Asia & PacificEast Asia & Pacific (excluding high income)East Asia & Pacific (IDA & IBRD countries)EcuadorEgypt, Arab Rep.El SalvadorEquatorial GuineaEritreaEstoniaEuro areaEurope & Central AsiaEurope & Central Asia (excluding high income)Europe & Central Asia (IDA & IBRD countries)European UnionFaroe IslandsFinlandFranceGabonGambia, TheGeorgiaGermanyGhanaGreeceGrenadaGuatemalaGuineaGuinea-BissauGuyanaHaitiHeavily indebted poor countries (HIPC)High incomeHondurasHong Kong SAR, ChinaHungaryIBRD onlyIcelandIDA & IBRD totalIDA blendIDA onlyIDA totalIndiaIndonesiaIran, Islamic Rep.IrelandIsraelItalyJamaicaJapanJordanKazakhstanKenyaKorea, Rep.KosovoKuwaitKyrgyz RepublicLao PDRLate-demographic dividendLatin America & Caribbean Latin America & Caribbean (excluding high income)Latin America & the Caribbean (IDA & IBRD countries)LatviaLeast developed countries: UN classificationLebanonLiberiaLithuaniaLow & middle incomeLow incomeLower middle incomeLuxembourgMacao SAR, ChinaMacedonia, FYRMadagascarMalawiMalaysiaMaliMaltaMauritaniaMauritiusMexicoMiddle East & North AfricaMiddle East & North Africa (excluding high income)Middle East & North Africa (IDA & IBRD countries)Middle incomeMoldovaMongoliaMontenegroMoroccoMozambiqueNamibiaNepalNetherlandsNew ZealandNicaraguaNigerNigeriaNorth AmericaNorwayOECD membersOmanOther small statesPakistanPanamaParaguayPeruPhilippinesPolandPortugalPost-demographic dividendPre-demographic dividendPuerto RicoQatarRomaniaRussian FederationRwandaSaudi ArabiaSenegalSerbiaSeychellesSierra LeoneSingaporeSlovak RepublicSloveniaSmall statesSouth AfricaSouth AsiaSouth Asia (IDA & IBRD)South SudanSpainSri LankaSt. Kitts and NevisSt. LuciaSt. Vincent and the GrenadinesSub-Saharan Africa Sub-Saharan Africa (excluding high income)Sub-Saharan Africa (IDA & IBRD countries)SudanSurinameSwazilandSwedenSwitzerlandTajikistanTanzaniaThailandTimor-LesteTogoTongaTrinidad and TobagoTunisiaTurkeyTurkmenistanUgandaUkraineUnited Arab EmiratesUnited KingdomUnited StatesUpper middle incomeUruguayUzbekistanVanuatuVenezuela, RBVietnamWest Bank and GazaWorldYemen, Rep.ZambiaZimbabwe Timeline:
This timeline shows a graph from 1976 to 2016 of Singapore. No data until 1975. Number of actual observations by date: 41.
Source name:
World Development Indicators
Source organization:
World Bank national accounts data, and OECD National Accounts data files.
Categories, topics:
Economy & Growth
Last updated:
apr 23, 2017
Indicators value changes by year
Minimum:
12.524 bln
jan 1, 1976
Maximum:
99.784 bln
jan 1, 2016
At the date of observation
Value
Absolute change
Change from previous value
jan 1, 1976
12.524 bln
+12.524 bln
0.0%
jan 1, 1977
13.184 bln
+659.993 mln
5.27%
jan 1, 1978
13.872 bln
+688.449 mln
5.22%
jan 1, 1979
14.783 bln
+910.891 mln
6.57%
jan 1, 1980
15.764 bln
+981.078 mln
6.64%
jan 1, 1981
16.655 bln
+891.089 mln
5.65%
jan 1, 1982
17.463 bln
+808.141 mln
4.85%
jan 1, 1983
18.166 bln
+702.75 mln
4.02%
jan 1, 1984
19.199 bln
+1.033 bln
5.69%
jan 1, 1985
20.322 bln
+1.122 bln
5.85%
jan 1, 1986
20.342 bln
+20.535 mln
0.1%
jan 1, 1987
21.144 bln
+801.76 mln
3.94%
jan 1, 1988
23.295 bln
+2.151 bln
10.17%
jan 1, 1989
26.0 bln
+2.705 bln
11.61%
jan 1, 1990
28.168 bln
+2.168 bln
8.34%
jan 1, 1991
30.267 bln
+2.099 bln
7.45%
jan 1, 1992
32.119 bln
+1.852 bln
6.12%
jan 1, 1993
33.976 bln
+1.856 bln
5.78%
jan 1, 1994
37.917 bln
+3.942 bln
11.6%
jan 1, 1995
40.764 bln
+2.847 bln
7.51%
jan 1, 1996
42.258 bln
+1.494 bln
3.66%
jan 1, 1997
44.964 bln
+2.706 bln
6.4%
jan 1, 1998
47.611 bln
+2.647 bln
5.89%
jan 1, 1999
46.177 bln
-1.434 bln
-3.01%
jan 1, 2000
50.365 bln
+4.188 bln
9.07%
jan 1, 2001
57.76 bln
+7.396 bln
14.68%
jan 1, 2002
61.608 bln
+3.848 bln
6.66%
jan 1, 2003
64.654 bln
+3.046 bln
4.94%
jan 1, 2004
65.125 bln
+471.36 mln
0.73%
jan 1, 2005
68.392 bln
+3.267 bln
5.02%
jan 1, 2006
70.725 bln
+2.333 bln
3.41%
jan 1, 2007
73.024 bln
+2.299 bln
3.25%
jan 1, 2008
77.514 bln
+4.49 bln
6.15%
jan 1, 2009
80.221 bln
+2.707 bln
3.49%
jan 1, 2010
79.313 bln
-907.444 mln
-1.13%
jan 1, 2011
83.989 bln
+4.675 bln
5.89%
jan 1, 2012
87.565 bln
+3.576 bln
4.26%
jan 1, 2013
90.665 bln
+3.1 bln
3.54%
jan 1, 2014
93.462 bln
+2.797 bln
3.08%
jan 1, 2015
95.475 bln
+2.013 bln
2.15%
jan 1, 2016
99.784 bln
+4.309 bln
4.51%
Ranking of countries by current statistics by years


Comments: