29
/
en
AIzaSyAYiBZKx7MnpbEhh9jyipgxe19OcubqV5w
April 1, 2024
216521
Pakistan
PAK
true
2
1
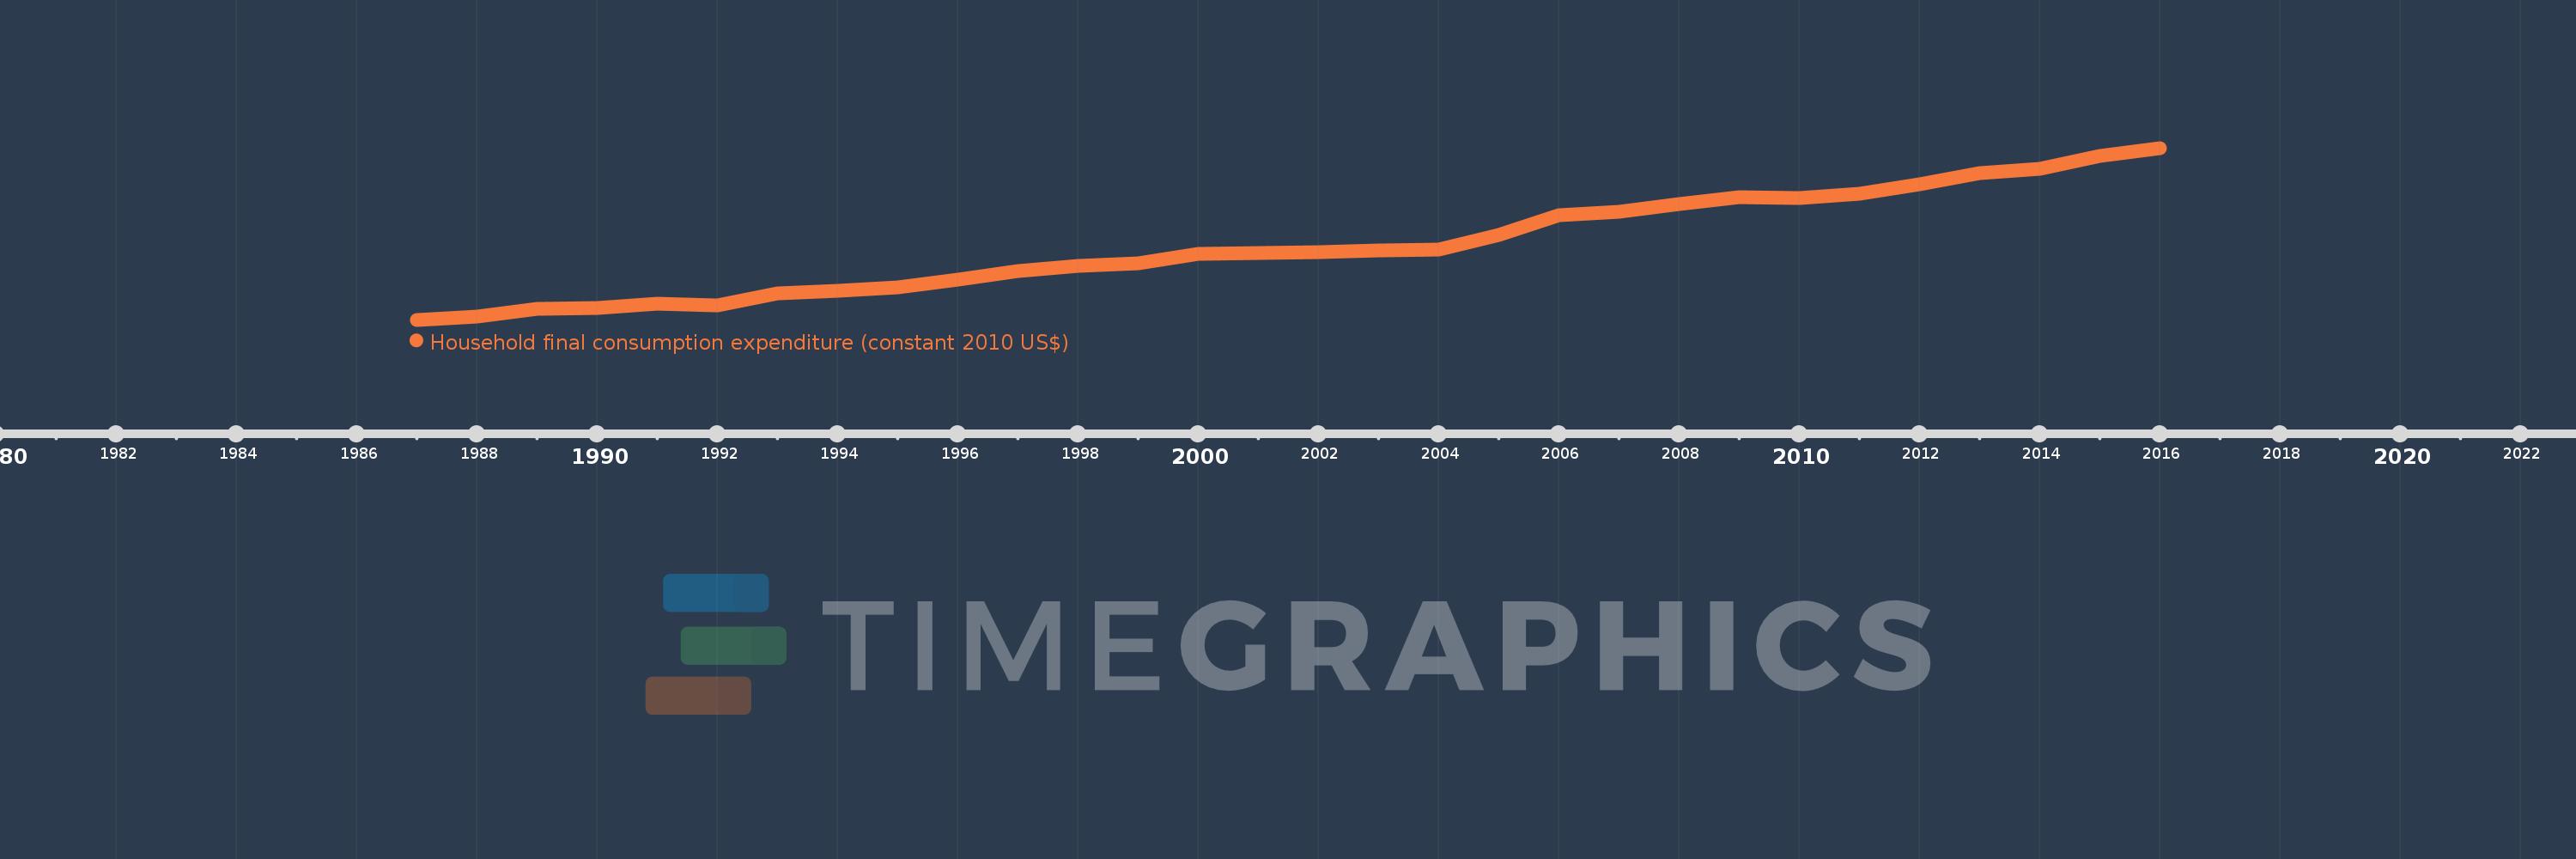
Household final consumption expenditure (constant 2010 US$)
2016,2015,2014,2013,2012,2011,2010,2009,2008,2007,2006,2005,2004,2003,2002,2001,2000,1999,1998,1997,1996,1995,1994,1993,1992,1991,1990,1989,1988,1987
This statistics in other country:
AfghanistanAlbaniaAlgeriaAngolaAntigua and BarbudaArab WorldArgentinaArmeniaArubaAustraliaAustriaAzerbaijanBahamas, TheBahrainBangladeshBarbadosBelarusBelgiumBelizeBeninBermudaBhutanBoliviaBosnia and HerzegovinaBotswanaBrazilBrunei DarussalamBulgariaBurkina FasoBurundiCabo VerdeCambodiaCameroonCanadaCaribbean small statesCentral African RepublicCentral Europe and the BalticsChadChileChinaColombiaComorosCongo, Dem. Rep.Congo, Rep.Costa RicaCote d'IvoireCroatiaCubaCyprusCzech RepublicDenmarkDominicaDominican RepublicEarly-demographic dividendEast Asia & PacificEast Asia & Pacific (excluding high income)East Asia & Pacific (IDA & IBRD countries)EcuadorEgypt, Arab Rep.El SalvadorEquatorial GuineaEritreaEstoniaEuro areaEurope & Central AsiaEurope & Central Asia (excluding high income)Europe & Central Asia (IDA & IBRD countries)European UnionFaroe IslandsFinlandFranceGabonGambia, TheGeorgiaGermanyGhanaGreeceGrenadaGuatemalaGuineaGuinea-BissauGuyanaHaitiHeavily indebted poor countries (HIPC)High incomeHondurasHong Kong SAR, ChinaHungaryIBRD onlyIcelandIDA & IBRD totalIDA blendIDA onlyIDA totalIndiaIndonesiaIran, Islamic Rep.IrelandIsraelItalyJamaicaJapanJordanKazakhstanKenyaKorea, Rep.KosovoKuwaitKyrgyz RepublicLao PDRLate-demographic dividendLatin America & Caribbean Latin America & Caribbean (excluding high income)Latin America & the Caribbean (IDA & IBRD countries)LatviaLeast developed countries: UN classificationLebanonLiberiaLithuaniaLow & middle incomeLow incomeLower middle incomeLuxembourgMacao SAR, ChinaMacedonia, FYRMadagascarMalawiMalaysiaMaliMaltaMauritaniaMauritiusMexicoMiddle East & North AfricaMiddle East & North Africa (excluding high income)Middle East & North Africa (IDA & IBRD countries)Middle incomeMoldovaMongoliaMontenegroMoroccoMozambiqueNamibiaNepalNetherlandsNew ZealandNicaraguaNigerNigeriaNorth AmericaNorwayOECD membersOmanOther small statesPakistanPanamaParaguayPeruPhilippinesPolandPortugalPost-demographic dividendPre-demographic dividendPuerto RicoQatarRomaniaRussian FederationRwandaSaudi ArabiaSenegalSerbiaSeychellesSierra LeoneSingaporeSlovak RepublicSloveniaSmall statesSouth AfricaSouth AsiaSouth Asia (IDA & IBRD)South SudanSpainSri LankaSt. Kitts and NevisSt. LuciaSt. Vincent and the GrenadinesSub-Saharan Africa Sub-Saharan Africa (excluding high income)Sub-Saharan Africa (IDA & IBRD countries)SudanSurinameSwazilandSwedenSwitzerlandTajikistanTanzaniaThailandTimor-LesteTogoTongaTrinidad and TobagoTunisiaTurkeyTurkmenistanUgandaUkraineUnited Arab EmiratesUnited KingdomUnited StatesUpper middle incomeUruguayUzbekistanVanuatuVenezuela, RBVietnamWest Bank and GazaWorldYemen, Rep.ZambiaZimbabwe Timeline:
This timeline shows a graph from 1987 to 2016 of Pakistan. No data until 1986. Number of actual observations by date: 30.
Source name:
World Development Indicators
Source organization:
World Bank national accounts data, and OECD National Accounts data files.
Categories, topics:
Economy & Growth
Last updated:
apr 23, 2017
Indicators value changes by year
Minimum:
53.987 bln
jan 1, 1987
Maximum:
172.826 bln
jan 1, 2016
At the date of observation
Value
Absolute change
Change from previous value
jan 1, 1987
53.987 bln
+53.987 bln
0.0%
jan 1, 1988
55.889 bln
+1.902 bln
3.52%
jan 1, 1989
61.575 bln
+5.686 bln
10.17%
jan 1, 1990
62.08 bln
+504.555 mln
0.82%
jan 1, 1991
64.874 bln
+2.794 bln
4.5%
jan 1, 1992
64.014 bln
-859.684 mln
-1.33%
jan 1, 1993
72.345 bln
+8.331 bln
13.01%
jan 1, 1994
73.899 bln
+1.554 bln
2.15%
jan 1, 1995
76.462 bln
+2.562 bln
3.47%
jan 1, 1996
81.86 bln
+5.398 bln
7.06%
jan 1, 1997
87.691 bln
+5.831 bln
7.12%
jan 1, 1998
91.371 bln
+3.68 bln
4.2%
jan 1, 1999
92.797 bln
+1.427 bln
1.56%
jan 1, 2000
99.691 bln
+6.894 bln
7.43%
jan 1, 2001
100.097 bln
+405.391 mln
0.41%
jan 1, 2002
100.642 bln
+545.946 mln
0.55%
jan 1, 2003
102.053 bln
+1.41 bln
1.4%
jan 1, 2004
102.476 bln
+423.464 mln
0.41%
jan 1, 2005
112.867 bln
+10.391 bln
10.14%
jan 1, 2006
126.178 bln
+13.31 bln
11.79%
jan 1, 2007
128.697 bln
+2.52 bln
2.0%
jan 1, 2008
134.255 bln
+5.557 bln
4.32%
jan 1, 2009
139.033 bln
+4.779 bln
3.56%
jan 1, 2010
138.366 bln
-667.283 mln
-0.48%
jan 1, 2011
141.421 bln
+3.055 bln
2.21%
jan 1, 2012
147.907 bln
+6.486 bln
4.59%
jan 1, 2013
155.351 bln
+7.445 bln
5.03%
jan 1, 2014
158.674 bln
+3.323 bln
2.14%
jan 1, 2015
167.54 bln
+8.866 bln
5.59%
jan 1, 2016
172.826 bln
+5.286 bln
3.16%
Ranking of countries by current statistics by years


Comments: