29
/
en
AIzaSyAYiBZKx7MnpbEhh9jyipgxe19OcubqV5w
April 1, 2024
115878
Cuba
CUB
true
2
1
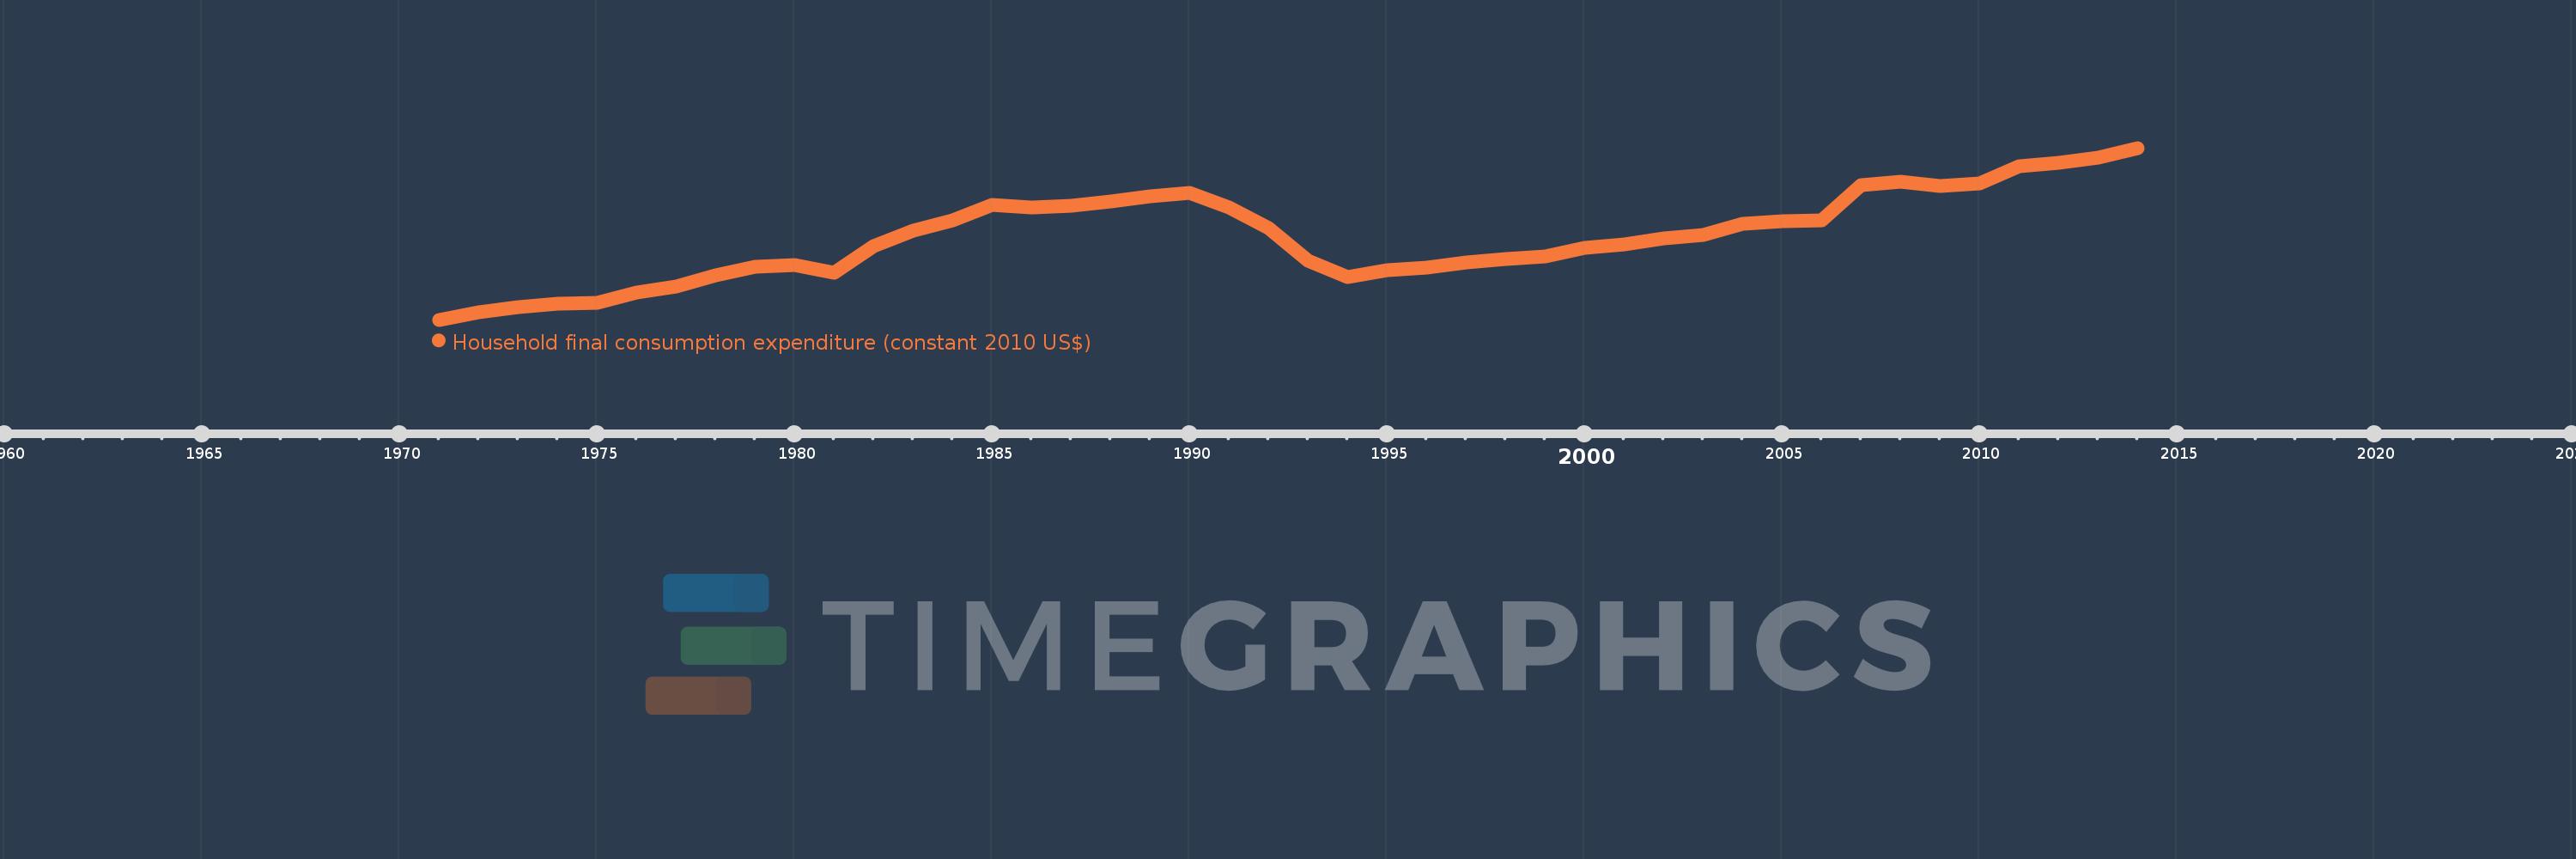
Household final consumption expenditure (constant 2010 US$)
2014,2013,2012,2011,2010,2009,2008,2007,2006,2005,2004,2003,2002,2001,2000,1999,1998,1997,1996,1995,1994,1993,1992,1991,1990,1989,1988,1987,1986,1985,1984,1983,1982,1981,1980,1979,1978,1977,1976,1975,1974,1973,1972,1971
This statistics in other country:
AfghanistanAlbaniaAlgeriaAngolaAntigua and BarbudaArab WorldArgentinaArmeniaArubaAustraliaAustriaAzerbaijanBahamas, TheBahrainBangladeshBarbadosBelarusBelgiumBelizeBeninBermudaBhutanBoliviaBosnia and HerzegovinaBotswanaBrazilBrunei DarussalamBulgariaBurkina FasoBurundiCabo VerdeCambodiaCameroonCanadaCaribbean small statesCentral African RepublicCentral Europe and the BalticsChadChileChinaColombiaComorosCongo, Dem. Rep.Congo, Rep.Costa RicaCote d'IvoireCroatiaCubaCyprusCzech RepublicDenmarkDominicaDominican RepublicEarly-demographic dividendEast Asia & PacificEast Asia & Pacific (excluding high income)East Asia & Pacific (IDA & IBRD countries)EcuadorEgypt, Arab Rep.El SalvadorEquatorial GuineaEritreaEstoniaEuro areaEurope & Central AsiaEurope & Central Asia (excluding high income)Europe & Central Asia (IDA & IBRD countries)European UnionFaroe IslandsFinlandFranceGabonGambia, TheGeorgiaGermanyGhanaGreeceGrenadaGuatemalaGuineaGuinea-BissauGuyanaHaitiHeavily indebted poor countries (HIPC)High incomeHondurasHong Kong SAR, ChinaHungaryIBRD onlyIcelandIDA & IBRD totalIDA blendIDA onlyIDA totalIndiaIndonesiaIran, Islamic Rep.IrelandIsraelItalyJamaicaJapanJordanKazakhstanKenyaKorea, Rep.KosovoKuwaitKyrgyz RepublicLao PDRLate-demographic dividendLatin America & Caribbean Latin America & Caribbean (excluding high income)Latin America & the Caribbean (IDA & IBRD countries)LatviaLeast developed countries: UN classificationLebanonLiberiaLithuaniaLow & middle incomeLow incomeLower middle incomeLuxembourgMacao SAR, ChinaMacedonia, FYRMadagascarMalawiMalaysiaMaliMaltaMauritaniaMauritiusMexicoMiddle East & North AfricaMiddle East & North Africa (excluding high income)Middle East & North Africa (IDA & IBRD countries)Middle incomeMoldovaMongoliaMontenegroMoroccoMozambiqueNamibiaNepalNetherlandsNew ZealandNicaraguaNigerNigeriaNorth AmericaNorwayOECD membersOmanOther small statesPakistanPanamaParaguayPeruPhilippinesPolandPortugalPost-demographic dividendPre-demographic dividendPuerto RicoQatarRomaniaRussian FederationRwandaSaudi ArabiaSenegalSerbiaSeychellesSierra LeoneSingaporeSlovak RepublicSloveniaSmall statesSouth AfricaSouth AsiaSouth Asia (IDA & IBRD)South SudanSpainSri LankaSt. Kitts and NevisSt. LuciaSt. Vincent and the GrenadinesSub-Saharan Africa Sub-Saharan Africa (excluding high income)Sub-Saharan Africa (IDA & IBRD countries)SudanSurinameSwazilandSwedenSwitzerlandTajikistanTanzaniaThailandTimor-LesteTogoTongaTrinidad and TobagoTunisiaTurkeyTurkmenistanUgandaUkraineUnited Arab EmiratesUnited KingdomUnited StatesUpper middle incomeUruguayUzbekistanVanuatuVenezuela, RBVietnamWest Bank and GazaWorldYemen, Rep.ZambiaZimbabwe Timeline:
This timeline shows a graph from 1971 to 2014 of Cuba. No data until 1970. Number of actual observations by date: 44.
Source name:
World Development Indicators
Source organization:
World Bank national accounts data, and OECD National Accounts data files.
Categories, topics:
Economy & Growth
Last updated:
apr 23, 2017
Indicators value changes by year
Minimum:
11.917 bln
jan 1, 1971
Maximum:
34.788 bln
jan 1, 2014
At the date of observation
Value
Absolute change
Change from previous value
jan 1, 1971
11.917 bln
+11.917 bln
0.0%
jan 1, 1972
12.939 bln
+1.022 bln
8.57%
jan 1, 1973
13.563 bln
+624.313 mln
4.83%
jan 1, 1974
14.031 bln
+467.547 mln
3.45%
jan 1, 1975
14.173 bln
+142.602 mln
1.02%
jan 1, 1976
15.511 bln
+1.337 bln
9.44%
jan 1, 1977
16.343 bln
+831.973 mln
5.36%
jan 1, 1978
17.774 bln
+1.432 bln
8.76%
jan 1, 1979
18.962 bln
+1.188 bln
6.68%
jan 1, 1980
19.193 bln
+230.869 mln
1.22%
jan 1, 1981
18.192 bln
-1.001 bln
-5.21%
jan 1, 1982
21.736 bln
+3.543 bln
19.48%
jan 1, 1983
23.813 bln
+2.077 bln
9.56%
jan 1, 1984
25.165 bln
+1.352 bln
5.68%
jan 1, 1985
27.259 bln
+2.093 bln
8.32%
jan 1, 1986
26.887 bln
-372.022 mln
-1.36%
jan 1, 1987
27.147 bln
+260.472 mln
0.97%
jan 1, 1988
27.674 bln
+527.376 mln
1.94%
jan 1, 1989
28.308 bln
+633.494 mln
2.29%
jan 1, 1990
28.755 bln
+446.983 mln
1.58%
jan 1, 1991
26.862 bln
-1.893 bln
-6.58%
jan 1, 1992
24.111 bln
-2.75 bln
-10.24%
jan 1, 1993
19.808 bln
-4.303 bln
-17.85%
jan 1, 1994
17.565 bln
-2.243 bln
-11.32%
jan 1, 1995
18.56 bln
+994.939 mln
5.66%
jan 1, 1996
18.833 bln
+273.013 mln
1.47%
jan 1, 1997
19.571 bln
+738.326 mln
3.92%
jan 1, 1998
20.023 bln
+452.056 mln
2.31%
jan 1, 1999
20.399 bln
+375.852 mln
1.88%
jan 1, 2000
21.443 bln
+1.044 bln
5.12%
jan 1, 2001
21.891 bln
+448.052 mln
2.09%
jan 1, 2002
22.728 bln
+836.69 mln
3.82%
jan 1, 2003
23.212 bln
+484.474 mln
2.13%
jan 1, 2004
24.651 bln
+1.439 bln
6.2%
jan 1, 2005
25.031 bln
+379.598 mln
1.54%
jan 1, 2006
25.126 bln
+94.673 mln
0.38%
jan 1, 2007
29.827 bln
+4.701 bln
18.71%
jan 1, 2008
30.28 bln
+452.96 mln
1.52%
jan 1, 2009
29.745 bln
-535.105 mln
-1.77%
jan 1, 2010
30.009 bln
+264.13 mln
0.89%
jan 1, 2011
32.369 bln
+2.36 bln
7.86%
jan 1, 2012
32.822 bln
+453.218 mln
1.4%
jan 1, 2013
33.543 bln
+721.168 mln
2.2%
jan 1, 2014
34.788 bln
+1.245 bln
3.71%
Ranking of countries by current statistics by years


Comments: