29
/
en
AIzaSyAYiBZKx7MnpbEhh9jyipgxe19OcubqV5w
April 1, 2024
183011
Macao SAR, China
MAC
true
2
1
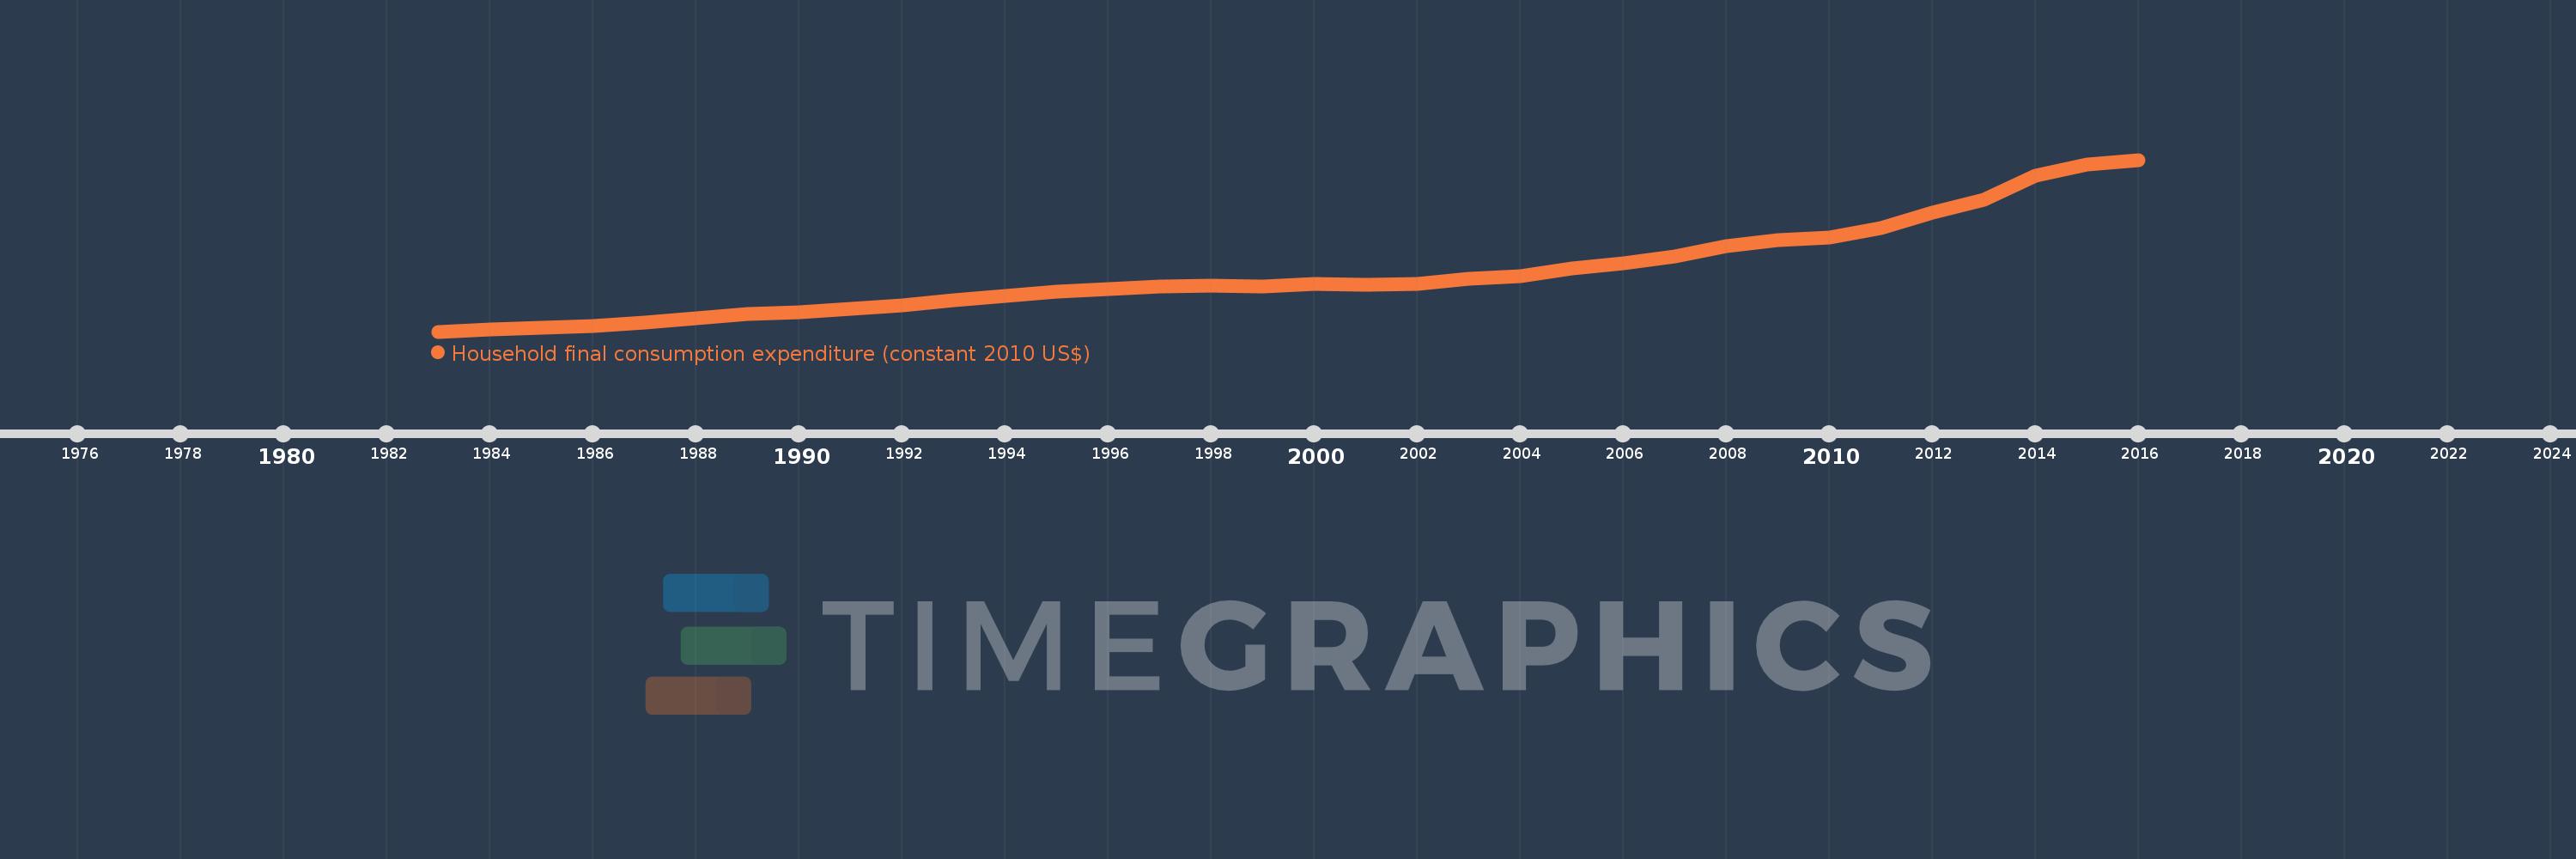
Household final consumption expenditure (constant 2010 US$)
2016,2015,2014,2013,2012,2011,2010,2009,2008,2007,2006,2005,2004,2003,2002,2001,2000,1999,1998,1997,1996,1995,1994,1993,1992,1991,1990,1989,1988,1987,1986,1985,1984,1983
This statistics in other country:
AfghanistanAlbaniaAlgeriaAngolaAntigua and BarbudaArab WorldArgentinaArmeniaArubaAustraliaAustriaAzerbaijanBahamas, TheBahrainBangladeshBarbadosBelarusBelgiumBelizeBeninBermudaBhutanBoliviaBosnia and HerzegovinaBotswanaBrazilBrunei DarussalamBulgariaBurkina FasoBurundiCabo VerdeCambodiaCameroonCanadaCaribbean small statesCentral African RepublicCentral Europe and the BalticsChadChileChinaColombiaComorosCongo, Dem. Rep.Congo, Rep.Costa RicaCote d'IvoireCroatiaCubaCyprusCzech RepublicDenmarkDominicaDominican RepublicEarly-demographic dividendEast Asia & PacificEast Asia & Pacific (excluding high income)East Asia & Pacific (IDA & IBRD countries)EcuadorEgypt, Arab Rep.El SalvadorEquatorial GuineaEritreaEstoniaEuro areaEurope & Central AsiaEurope & Central Asia (excluding high income)Europe & Central Asia (IDA & IBRD countries)European UnionFaroe IslandsFinlandFranceGabonGambia, TheGeorgiaGermanyGhanaGreeceGrenadaGuatemalaGuineaGuinea-BissauGuyanaHaitiHeavily indebted poor countries (HIPC)High incomeHondurasHong Kong SAR, ChinaHungaryIBRD onlyIcelandIDA & IBRD totalIDA blendIDA onlyIDA totalIndiaIndonesiaIran, Islamic Rep.IrelandIsraelItalyJamaicaJapanJordanKazakhstanKenyaKorea, Rep.KosovoKuwaitKyrgyz RepublicLao PDRLate-demographic dividendLatin America & Caribbean Latin America & Caribbean (excluding high income)Latin America & the Caribbean (IDA & IBRD countries)LatviaLeast developed countries: UN classificationLebanonLiberiaLithuaniaLow & middle incomeLow incomeLower middle incomeLuxembourgMacao SAR, ChinaMacedonia, FYRMadagascarMalawiMalaysiaMaliMaltaMauritaniaMauritiusMexicoMiddle East & North AfricaMiddle East & North Africa (excluding high income)Middle East & North Africa (IDA & IBRD countries)Middle incomeMoldovaMongoliaMontenegroMoroccoMozambiqueNamibiaNepalNetherlandsNew ZealandNicaraguaNigerNigeriaNorth AmericaNorwayOECD membersOmanOther small statesPakistanPanamaParaguayPeruPhilippinesPolandPortugalPost-demographic dividendPre-demographic dividendPuerto RicoQatarRomaniaRussian FederationRwandaSaudi ArabiaSenegalSerbiaSeychellesSierra LeoneSingaporeSlovak RepublicSloveniaSmall statesSouth AfricaSouth AsiaSouth Asia (IDA & IBRD)South SudanSpainSri LankaSt. Kitts and NevisSt. LuciaSt. Vincent and the GrenadinesSub-Saharan Africa Sub-Saharan Africa (excluding high income)Sub-Saharan Africa (IDA & IBRD countries)SudanSurinameSwazilandSwedenSwitzerlandTajikistanTanzaniaThailandTimor-LesteTogoTongaTrinidad and TobagoTunisiaTurkeyTurkmenistanUgandaUkraineUnited Arab EmiratesUnited KingdomUnited StatesUpper middle incomeUruguayUzbekistanVanuatuVenezuela, RBVietnamWest Bank and GazaWorldYemen, Rep.ZambiaZimbabwe Timeline:
This timeline shows a graph from 1983 to 2016 of Macao SAR, China. No data until 1982. Number of actual observations by date: 34.
Source name:
World Development Indicators
Source organization:
World Bank national accounts data, and OECD National Accounts data files.
Categories, topics:
Economy & Growth
Last updated:
apr 23, 2017
Indicators value changes by year
Minimum:
1.589 bln
jan 1, 1983
Maximum:
9.856 bln
jan 1, 2016
At the date of observation
Value
Absolute change
Change from previous value
jan 1, 1983
1.589 bln
+1.589 bln
0.0%
jan 1, 1984
1.686 bln
+96.922 mln
6.1%
jan 1, 1985
1.763 bln
+77.547 mln
4.6%
jan 1, 1986
1.873 bln
+109.328 mln
6.2%
jan 1, 1987
2.039 bln
+166.668 mln
8.9%
jan 1, 1988
2.215 bln
+175.384 mln
8.6%
jan 1, 1989
2.423 bln
+208.184 mln
9.4%
jan 1, 1990
2.527 bln
+104.185 mln
4.3%
jan 1, 1991
2.669 bln
+141.518 mln
5.6%
jan 1, 1992
2.861 bln
+192.14 mln
7.2%
jan 1, 1993
3.113 bln
+251.747 mln
8.8%
jan 1, 1994
3.315 bln
+202.313 mln
6.5%
jan 1, 1995
3.517 bln
+202.204 mln
6.1%
jan 1, 1996
3.615 bln
+98.477 mln
2.8%
jan 1, 1997
3.76 bln
+144.62 mln
4.0%
jan 1, 1998
3.813 bln
+52.642 mln
1.4%
jan 1, 1999
3.775 bln
-38.128 mln
-1.0%
jan 1, 2000
3.869 bln
+94.366 mln
2.5%
jan 1, 2001
3.83 bln
-38.69 mln
-1.0%
jan 1, 2002
3.903 bln
+72.776 mln
1.9%
jan 1, 2003
4.121 bln
+217.749 mln
5.58%
jan 1, 2004
4.258 bln
+137.495 mln
3.34%
jan 1, 2005
4.61 bln
+352.08 mln
8.27%
jan 1, 2006
4.893 bln
+282.228 mln
6.12%
jan 1, 2007
5.194 bln
+300.913 mln
6.15%
jan 1, 2008
5.694 bln
+500.609 mln
9.64%
jan 1, 2009
5.989 bln
+294.965 mln
5.18%
jan 1, 2010
6.131 bln
+141.902 mln
2.37%
jan 1, 2011
6.575 bln
+443.908 mln
7.24%
jan 1, 2012
7.3 bln
+724.882 mln
11.02%
jan 1, 2013
7.935 bln
+635.502 mln
8.71%
jan 1, 2014
9.103 bln
+1.168 bln
14.72%
jan 1, 2015
9.621 bln
+518.19 mln
5.69%
jan 1, 2016
9.856 bln
+234.605 mln
2.44%
Ranking of countries by current statistics by years


Comments: