29
/
en
AIzaSyAYiBZKx7MnpbEhh9jyipgxe19OcubqV5w
April 1, 2024
81791
Belgium
BEL
true
2
1
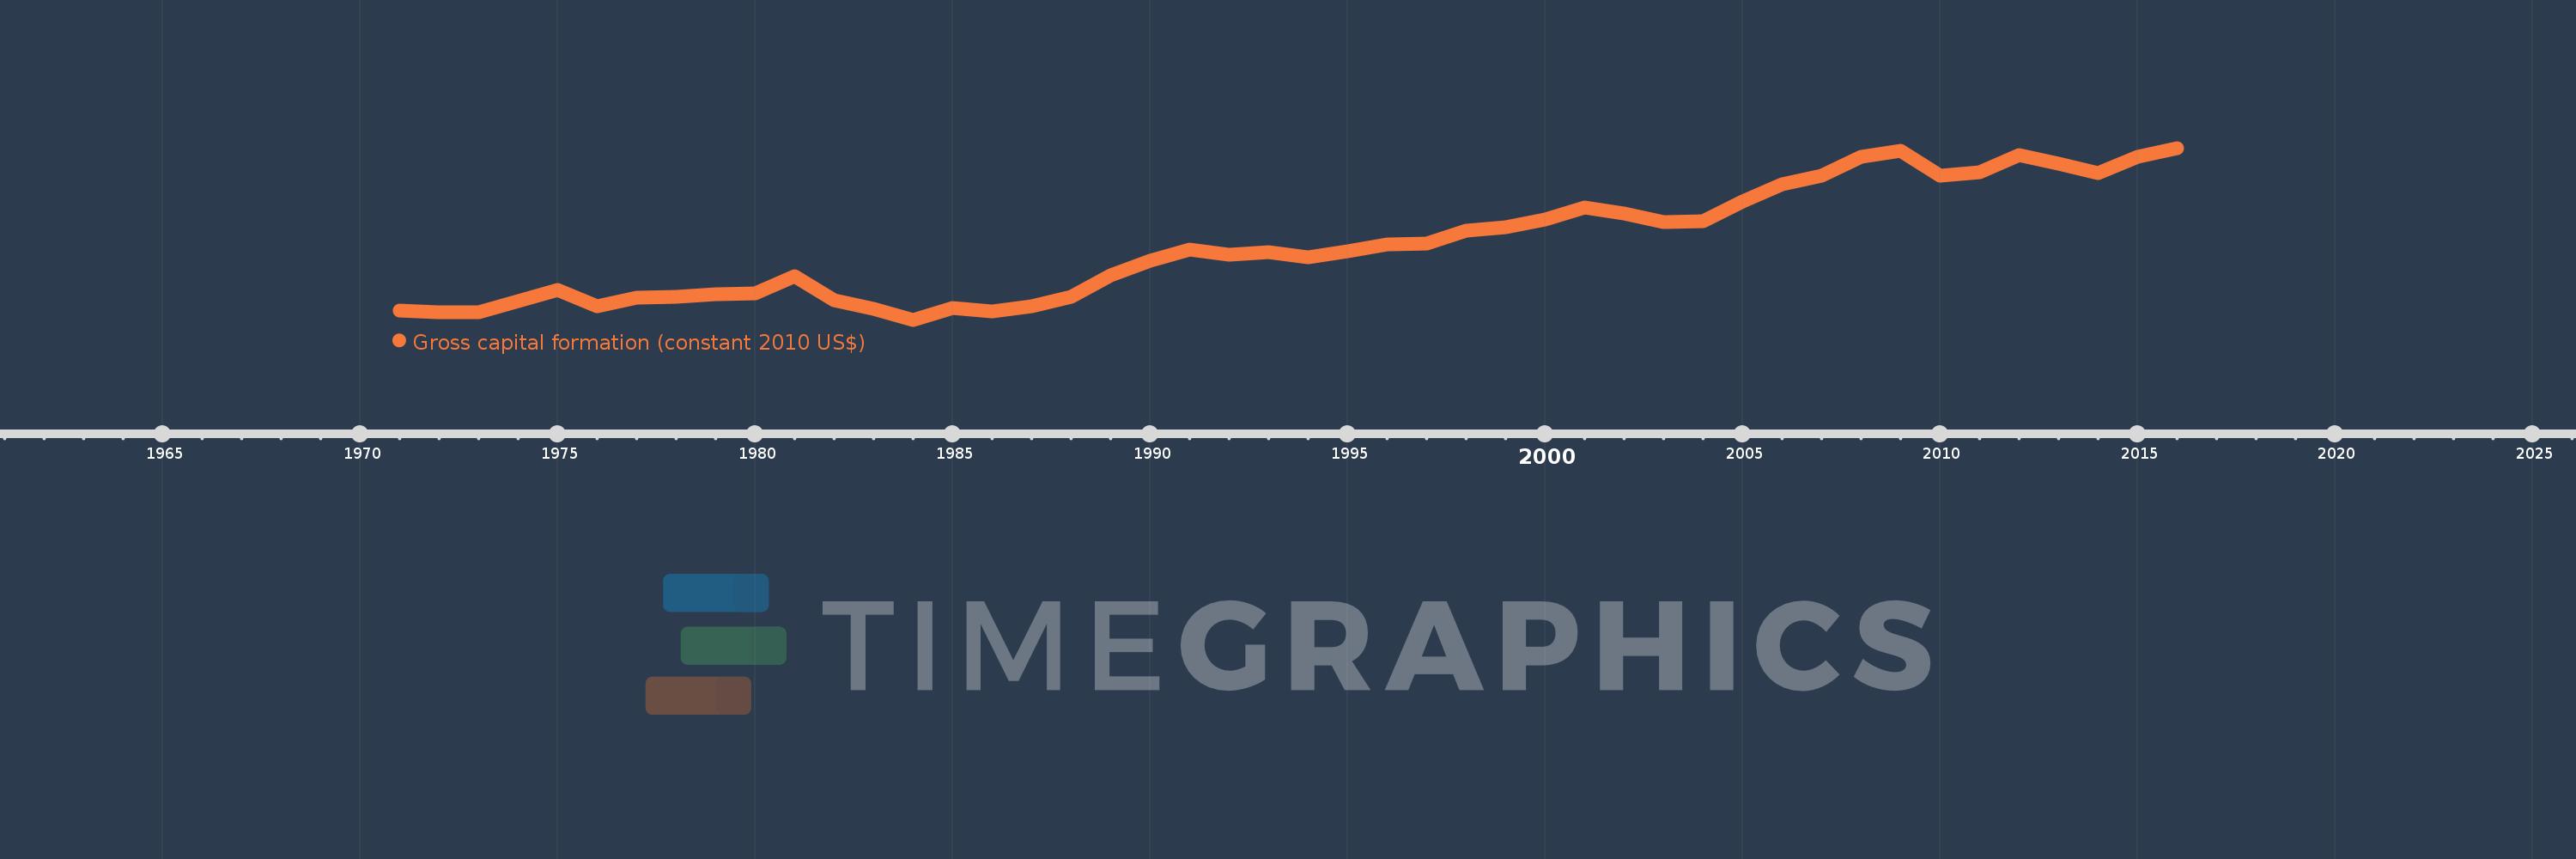
Gross capital formation (constant 2010 US$)
2016,2015,2014,2013,2012,2011,2010,2009,2008,2007,2006,2005,2004,2003,2002,2001,2000,1999,1998,1997,1996,1995,1994,1993,1992,1991,1990,1989,1988,1987,1986,1985,1984,1983,1982,1981,1980,1979,1978,1977,1976,1975,1974,1973,1972,1971
This statistics in other country:
AfghanistanAlbaniaAlgeriaAngolaAntigua and BarbudaArab WorldArgentinaArmeniaArubaAustraliaAustriaAzerbaijanBahamas, TheBahrainBangladeshBarbadosBelarusBelgiumBelizeBeninBermudaBhutanBoliviaBosnia and HerzegovinaBotswanaBrazilBrunei DarussalamBulgariaBurkina FasoBurundiCabo VerdeCambodiaCameroonCanadaCaribbean small statesCentral African RepublicCentral Europe and the BalticsChadChileChinaColombiaComorosCongo, Dem. Rep.Congo, Rep.Cote d'IvoireCroatiaCubaCyprusCzech RepublicDenmarkDominicaDominican RepublicEarly-demographic dividendEast Asia & PacificEast Asia & Pacific (excluding high income)East Asia & Pacific (IDA & IBRD countries)EcuadorEgypt, Arab Rep.El SalvadorEquatorial GuineaEritreaEstoniaEthiopiaEuro areaEurope & Central AsiaEurope & Central Asia (excluding high income)Europe & Central Asia (IDA & IBRD countries)European UnionFaroe IslandsFinlandFragile and conflict affected situationsFranceGabonGambia, TheGeorgiaGermanyGhanaGreeceGrenadaGuatemalaGuineaGuinea-BissauGuyanaHaitiHeavily indebted poor countries (HIPC)High incomeHondurasHong Kong SAR, ChinaHungaryIBRD onlyIcelandIDA & IBRD totalIDA blendIDA onlyIDA totalIndiaIndonesiaIran, Islamic Rep.IraqIrelandIsraelItalyJamaicaJapanJordanKazakhstanKenyaKorea, Rep.KosovoKuwaitKyrgyz RepublicLao PDRLate-demographic dividendLatin America & Caribbean Latin America & Caribbean (excluding high income)Latin America & the Caribbean (IDA & IBRD countries)LatviaLeast developed countries: UN classificationLebanonLiberiaLithuaniaLow & middle incomeLow incomeLower middle incomeLuxembourgMacao SAR, ChinaMacedonia, FYRMadagascarMalawiMalaysiaMaliMaltaMauritaniaMauritiusMexicoMiddle East & North AfricaMiddle East & North Africa (excluding high income)Middle East & North Africa (IDA & IBRD countries)Middle incomeMoldovaMongoliaMontenegroMoroccoMozambiqueNamibiaNepalNetherlandsNew ZealandNicaraguaNigerNigeriaNorth AmericaNorwayOECD membersOmanOther small statesPakistanPanamaParaguayPeruPhilippinesPolandPortugalPost-demographic dividendPre-demographic dividendPuerto RicoQatarRomaniaRussian FederationRwandaSaudi ArabiaSenegalSerbiaSeychellesSierra LeoneSingaporeSlovak RepublicSloveniaSmall statesSouth AfricaSouth AsiaSouth Asia (IDA & IBRD)South SudanSpainSri LankaSt. Kitts and NevisSt. LuciaSt. Vincent and the GrenadinesSub-Saharan Africa Sub-Saharan Africa (excluding high income)Sub-Saharan Africa (IDA & IBRD countries)SudanSurinameSwazilandSwedenSwitzerlandTajikistanTanzaniaThailandTimor-LesteTogoTongaTrinidad and TobagoTunisiaTurkeyTurkmenistanUgandaUkraineUnited Arab EmiratesUnited KingdomUnited StatesUpper middle incomeUruguayUzbekistanVanuatuVenezuela, RBVietnamWest Bank and GazaWorldYemen, Rep.ZambiaZimbabwe Timeline:
This timeline shows a graph from 1971 to 2016 of Belgium. No data until 1970. Number of actual observations by date: 46.
Source name:
World Development Indicators
Source organization:
World Bank national accounts data, and OECD National Accounts data files.
Categories, topics:
Economy & Growth
Last updated:
apr 23, 2017
Indicators value changes by year
Minimum:
41.501 bln
jan 1, 1984
Maximum:
121.047 bln
jan 1, 2016
At the date of observation
Value
Absolute change
Change from previous value
jan 1, 1971
45.811 bln
+45.811 bln
0.0%
jan 1, 1972
44.874 bln
-937.704 mln
-2.05%
jan 1, 1973
44.838 bln
-36.075 mln
-0.08%
jan 1, 1974
50.144 bln
+5.307 bln
11.84%
jan 1, 1975
55.304 bln
+5.159 bln
10.29%
jan 1, 1976
47.924 bln
-7.38 bln
-13.34%
jan 1, 1977
51.896 bln
+3.972 bln
8.29%
jan 1, 1978
52.288 bln
+392.006 mln
0.76%
jan 1, 1979
53.483 bln
+1.195 bln
2.29%
jan 1, 1980
53.655 bln
+171.859 mln
0.32%
jan 1, 1981
61.801 bln
+8.146 bln
15.18%
jan 1, 1982
50.488 bln
-11.313 bln
-18.31%
jan 1, 1983
46.687 bln
-3.8 bln
-7.53%
jan 1, 1984
41.501 bln
-5.186 bln
-11.11%
jan 1, 1985
46.765 bln
+5.264 bln
12.68%
jan 1, 1986
45.29 bln
-1.476 bln
-3.16%
jan 1, 1987
47.811 bln
+2.521 bln
5.57%
jan 1, 1988
52.228 bln
+4.417 bln
9.24%
jan 1, 1989
62.082 bln
+9.854 bln
18.87%
jan 1, 1990
68.826 bln
+6.743 bln
10.86%
jan 1, 1991
74.105 bln
+5.28 bln
7.67%
jan 1, 1992
71.418 bln
-2.687 bln
-3.63%
jan 1, 1993
72.724 bln
+1.306 bln
1.83%
jan 1, 1994
70.574 bln
-2.15 bln
-2.96%
jan 1, 1995
73.231 bln
+2.657 bln
3.76%
jan 1, 1996
76.243 bln
+3.013 bln
4.11%
jan 1, 1997
76.954 bln
+711.043 mln
0.93%
jan 1, 1998
82.81 bln
+5.856 bln
7.61%
jan 1, 1999
84.383 bln
+1.573 bln
1.9%
jan 1, 2000
87.746 bln
+3.363 bln
3.99%
jan 1, 2001
93.343 bln
+5.597 bln
6.38%
jan 1, 2002
90.785 bln
-2.559 bln
-2.74%
jan 1, 2003
86.894 bln
-3.891 bln
-4.29%
jan 1, 2004
87.126 bln
+232.311 mln
0.27%
jan 1, 2005
96.307 bln
+9.181 bln
10.54%
jan 1, 2006
104.242 bln
+7.934 bln
8.24%
jan 1, 2007
108.116 bln
+3.874 bln
3.72%
jan 1, 2008
116.918 bln
+8.802 bln
8.14%
jan 1, 2009
119.68 bln
+2.763 bln
2.36%
jan 1, 2010
108.052 bln
-11.628 bln
-9.72%
jan 1, 2011
109.734 bln
+1.681 bln
1.56%
jan 1, 2012
117.665 bln
+7.931 bln
7.23%
jan 1, 2013
113.664 bln
-4.001 bln
-3.4%
jan 1, 2014
109.231 bln
-4.432 bln
-3.9%
jan 1, 2015
116.787 bln
+7.556 bln
6.92%
jan 1, 2016
121.047 bln
+4.26 bln
3.65%
Ranking of countries by current statistics by years


Comments: