29
/
en
AIzaSyAYiBZKx7MnpbEhh9jyipgxe19OcubqV5w
April 1, 2024
76208
Bahamas, The
BHS
true
2
1
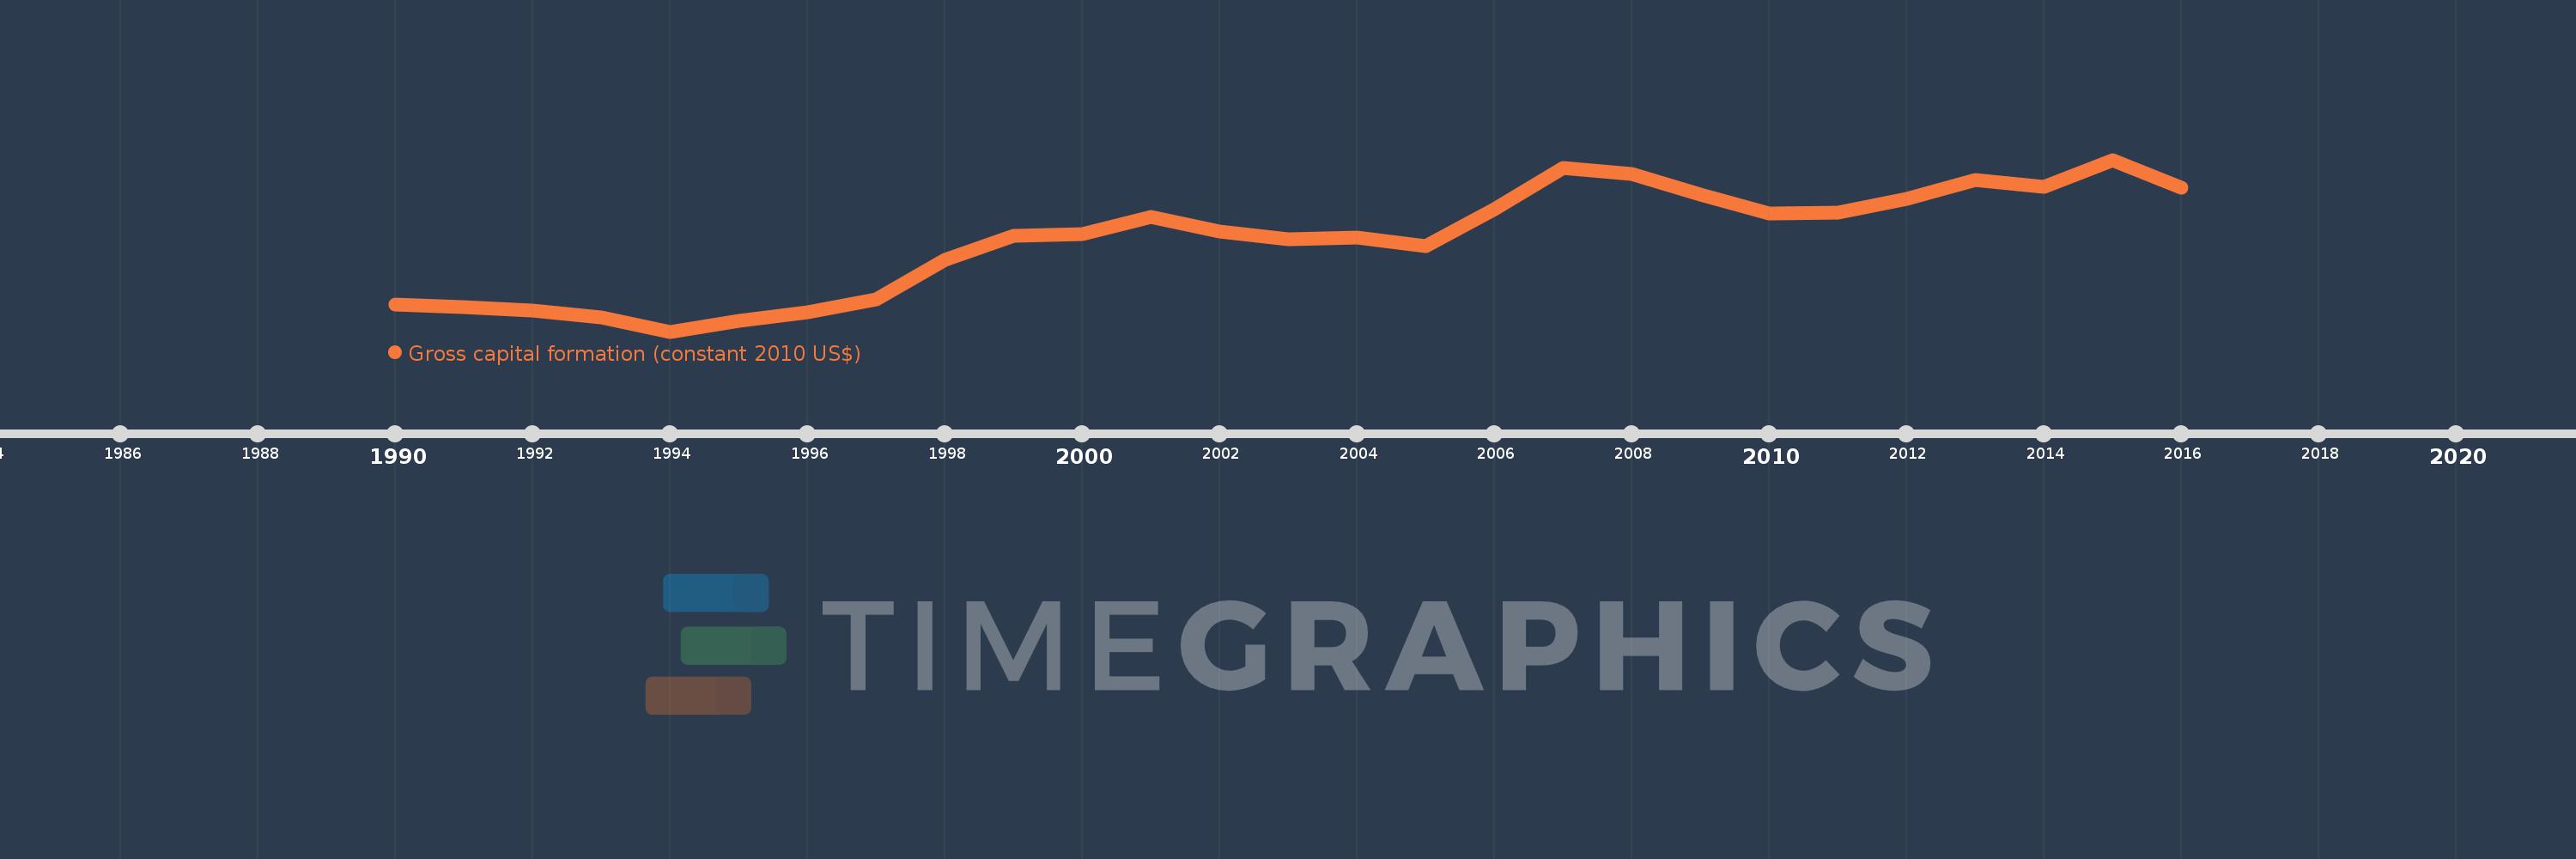
Gross capital formation (constant 2010 US$)
2016,2015,2014,2013,2012,2011,2010,2009,2008,2007,2006,2005,2004,2003,2002,2001,2000,1999,1998,1997,1996,1995,1994,1993,1992,1991,1990
This statistics in other country:
AfghanistanAlbaniaAlgeriaAngolaAntigua and BarbudaArab WorldArgentinaArmeniaArubaAustraliaAustriaAzerbaijanBahamas, TheBahrainBangladeshBarbadosBelarusBelgiumBelizeBeninBermudaBhutanBoliviaBosnia and HerzegovinaBotswanaBrazilBrunei DarussalamBulgariaBurkina FasoBurundiCabo VerdeCambodiaCameroonCanadaCaribbean small statesCentral African RepublicCentral Europe and the BalticsChadChileChinaColombiaComorosCongo, Dem. Rep.Congo, Rep.Cote d'IvoireCroatiaCubaCyprusCzech RepublicDenmarkDominicaDominican RepublicEarly-demographic dividendEast Asia & PacificEast Asia & Pacific (excluding high income)East Asia & Pacific (IDA & IBRD countries)EcuadorEgypt, Arab Rep.El SalvadorEquatorial GuineaEritreaEstoniaEthiopiaEuro areaEurope & Central AsiaEurope & Central Asia (excluding high income)Europe & Central Asia (IDA & IBRD countries)European UnionFaroe IslandsFinlandFragile and conflict affected situationsFranceGabonGambia, TheGeorgiaGermanyGhanaGreeceGrenadaGuatemalaGuineaGuinea-BissauGuyanaHaitiHeavily indebted poor countries (HIPC)High incomeHondurasHong Kong SAR, ChinaHungaryIBRD onlyIcelandIDA & IBRD totalIDA blendIDA onlyIDA totalIndiaIndonesiaIran, Islamic Rep.IraqIrelandIsraelItalyJamaicaJapanJordanKazakhstanKenyaKorea, Rep.KosovoKuwaitKyrgyz RepublicLao PDRLate-demographic dividendLatin America & Caribbean Latin America & Caribbean (excluding high income)Latin America & the Caribbean (IDA & IBRD countries)LatviaLeast developed countries: UN classificationLebanonLiberiaLithuaniaLow & middle incomeLow incomeLower middle incomeLuxembourgMacao SAR, ChinaMacedonia, FYRMadagascarMalawiMalaysiaMaliMaltaMauritaniaMauritiusMexicoMiddle East & North AfricaMiddle East & North Africa (excluding high income)Middle East & North Africa (IDA & IBRD countries)Middle incomeMoldovaMongoliaMontenegroMoroccoMozambiqueNamibiaNepalNetherlandsNew ZealandNicaraguaNigerNigeriaNorth AmericaNorwayOECD membersOmanOther small statesPakistanPanamaParaguayPeruPhilippinesPolandPortugalPost-demographic dividendPre-demographic dividendPuerto RicoQatarRomaniaRussian FederationRwandaSaudi ArabiaSenegalSerbiaSeychellesSierra LeoneSingaporeSlovak RepublicSloveniaSmall statesSouth AfricaSouth AsiaSouth Asia (IDA & IBRD)South SudanSpainSri LankaSt. Kitts and NevisSt. LuciaSt. Vincent and the GrenadinesSub-Saharan Africa Sub-Saharan Africa (excluding high income)Sub-Saharan Africa (IDA & IBRD countries)SudanSurinameSwazilandSwedenSwitzerlandTajikistanTanzaniaThailandTimor-LesteTogoTongaTrinidad and TobagoTunisiaTurkeyTurkmenistanUgandaUkraineUnited Arab EmiratesUnited KingdomUnited StatesUpper middle incomeUruguayUzbekistanVanuatuVenezuela, RBVietnamWest Bank and GazaWorldYemen, Rep.ZambiaZimbabwe Timeline:
This timeline shows a graph from 1990 to 2016 of Bahamas, The. No data until 1989. Number of actual observations by date: 27.
Source name:
World Development Indicators
Source organization:
World Bank national accounts data, and OECD National Accounts data files.
Categories, topics:
Economy & Growth
Last updated:
apr 23, 2017
Indicators value changes by year
Minimum:
693.005 mln
jan 1, 1994
Maximum:
2.565 bln
jan 1, 2015
At the date of observation
Value
Absolute change
Change from previous value
jan 1, 1990
991.554 mln
+991.554 mln
0.0%
jan 1, 1991
960.877 mln
-30.677 mln
-3.09%
jan 1, 1992
921.954 mln
-38.924 mln
-4.05%
jan 1, 1993
851.253 mln
-70.701 mln
-7.67%
jan 1, 1994
693.005 mln
-158.249 mln
-18.59%
jan 1, 1995
807.292 mln
+114.288 mln
16.49%
jan 1, 1996
906.641 mln
+99.348 mln
12.31%
jan 1, 1997
1.044 bln
+137.01 mln
15.11%
jan 1, 1998
1.475 bln
+431.499 mln
41.35%
jan 1, 1999
1.737 bln
+262.04 mln
17.76%
jan 1, 2000
1.754 bln
+16.621 mln
0.96%
jan 1, 2001
1.947 bln
+193.598 mln
11.04%
jan 1, 2002
1.78 bln
-167.595 mln
-8.61%
jan 1, 2003
1.697 bln
-83.115 mln
-4.67%
jan 1, 2004
1.716 bln
+19.318 mln
1.14%
jan 1, 2005
1.629 bln
-87.248 mln
-5.08%
jan 1, 2006
2.031 bln
+402.206 mln
24.69%
jan 1, 2007
2.477 bln
+446.481 mln
21.98%
jan 1, 2008
2.412 bln
-65.172 mln
-2.63%
jan 1, 2009
2.188 bln
-223.794 mln
-9.28%
jan 1, 2010
1.982 bln
-206.322 mln
-9.43%
jan 1, 2011
1.994 bln
+12.191 mln
0.62%
jan 1, 2012
2.142 bln
+147.887 mln
7.42%
jan 1, 2013
2.342 bln
+199.932 mln
9.33%
jan 1, 2014
2.275 bln
-67.081 mln
-2.86%
jan 1, 2015
2.565 bln
+290.395 mln
12.76%
jan 1, 2016
2.26 bln
-305.805 mln
-11.92%
Ranking of countries by current statistics by years


Comments: