29
/
en
AIzaSyAYiBZKx7MnpbEhh9jyipgxe19OcubqV5w
April 1, 2024
268028
Tunisia
TUN
true
2
1
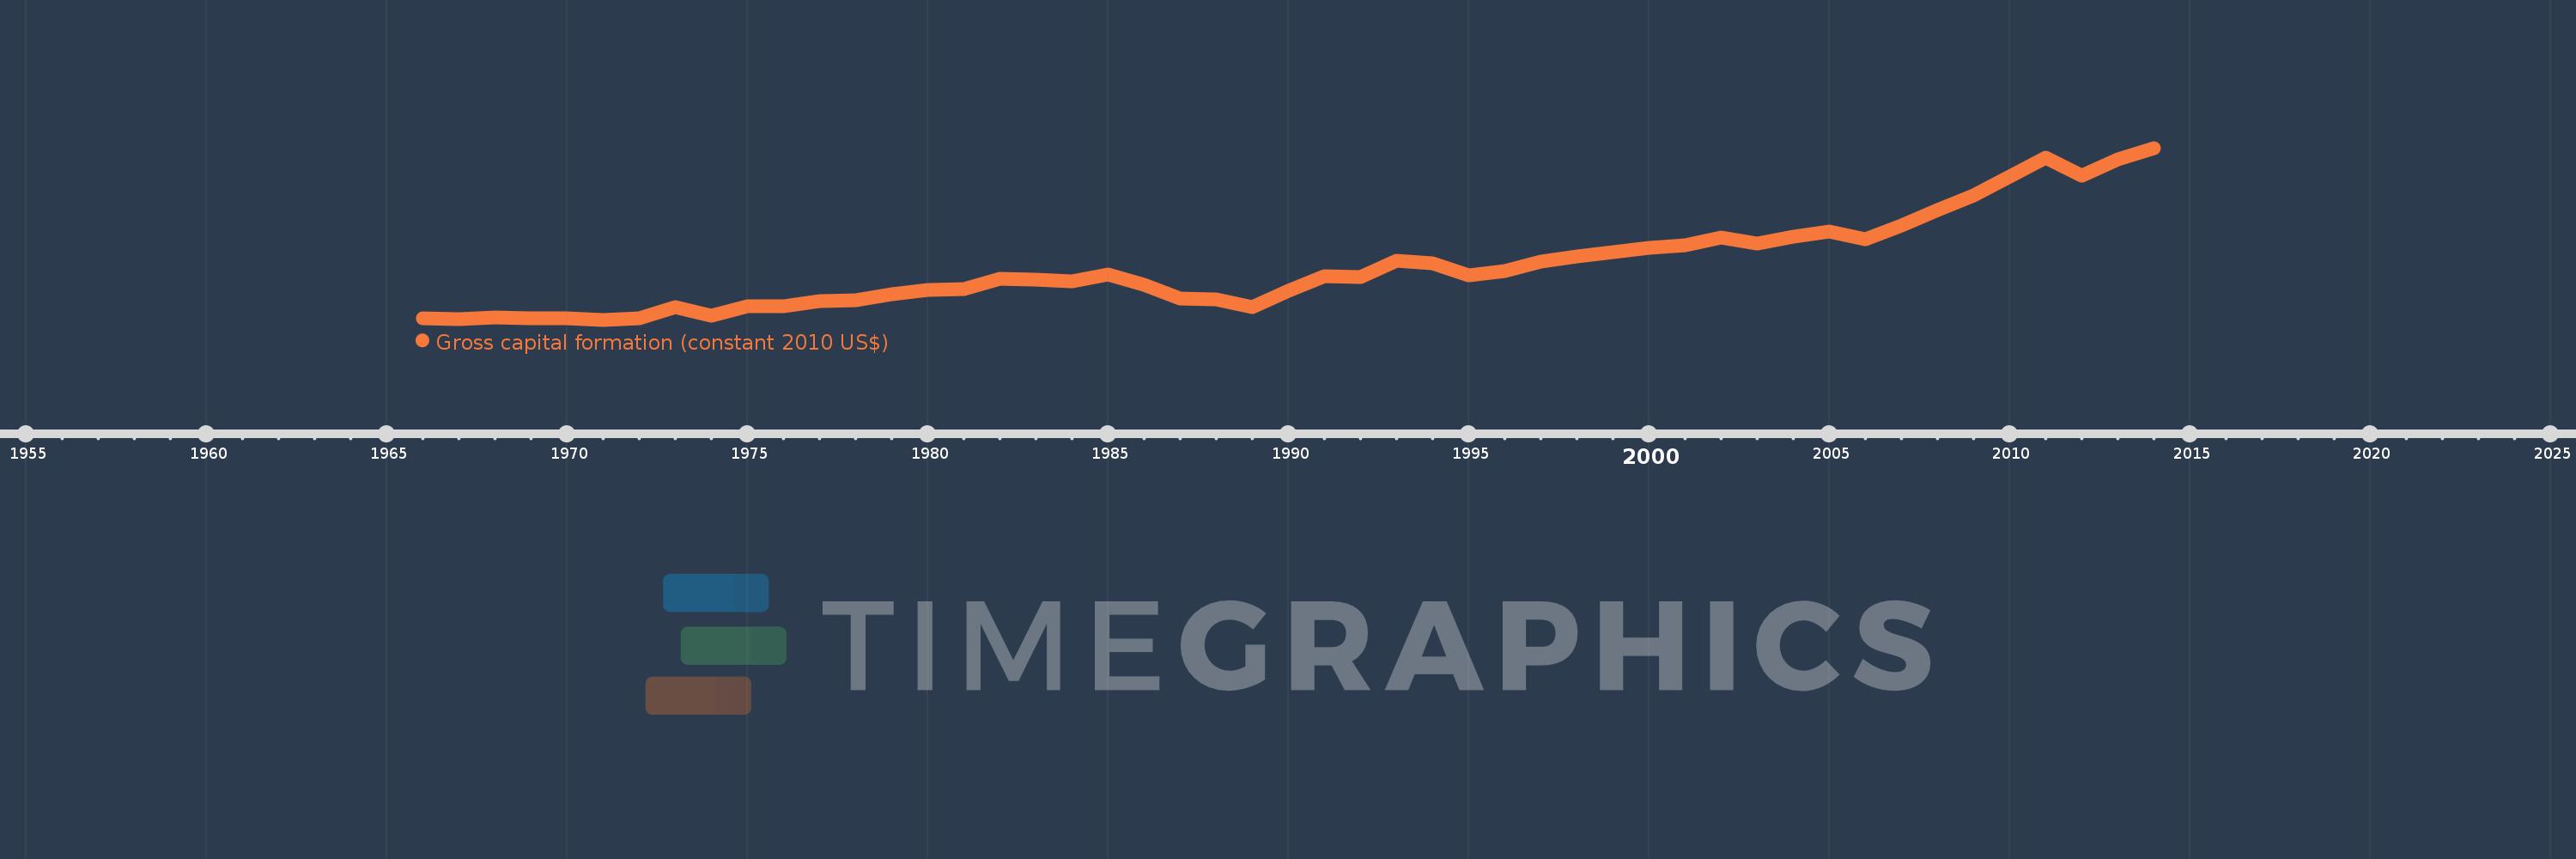
Gross capital formation (constant 2010 US$)
2014,2013,2012,2011,2010,2009,2008,2007,2006,2005,2004,2003,2002,2001,2000,1999,1998,1997,1996,1995,1994,1993,1992,1991,1990,1989,1988,1987,1986,1985,1984,1983,1982,1981,1980,1979,1978,1977,1976,1975,1974,1973,1972,1971,1970,1969,1968,1967,1966
This statistics in other country:
AfghanistanAlbaniaAlgeriaAngolaAntigua and BarbudaArab WorldArgentinaArmeniaArubaAustraliaAustriaAzerbaijanBahamas, TheBahrainBangladeshBarbadosBelarusBelgiumBelizeBeninBermudaBhutanBoliviaBosnia and HerzegovinaBotswanaBrazilBrunei DarussalamBulgariaBurkina FasoBurundiCabo VerdeCambodiaCameroonCanadaCaribbean small statesCentral African RepublicCentral Europe and the BalticsChadChileChinaColombiaComorosCongo, Dem. Rep.Congo, Rep.Cote d'IvoireCroatiaCubaCyprusCzech RepublicDenmarkDominicaDominican RepublicEarly-demographic dividendEast Asia & PacificEast Asia & Pacific (excluding high income)East Asia & Pacific (IDA & IBRD countries)EcuadorEgypt, Arab Rep.El SalvadorEquatorial GuineaEritreaEstoniaEthiopiaEuro areaEurope & Central AsiaEurope & Central Asia (excluding high income)Europe & Central Asia (IDA & IBRD countries)European UnionFaroe IslandsFinlandFragile and conflict affected situationsFranceGabonGambia, TheGeorgiaGermanyGhanaGreeceGrenadaGuatemalaGuineaGuinea-BissauGuyanaHaitiHeavily indebted poor countries (HIPC)High incomeHondurasHong Kong SAR, ChinaHungaryIBRD onlyIcelandIDA & IBRD totalIDA blendIDA onlyIDA totalIndiaIndonesiaIran, Islamic Rep.IraqIrelandIsraelItalyJamaicaJapanJordanKazakhstanKenyaKorea, Rep.KosovoKuwaitKyrgyz RepublicLao PDRLate-demographic dividendLatin America & Caribbean Latin America & Caribbean (excluding high income)Latin America & the Caribbean (IDA & IBRD countries)LatviaLeast developed countries: UN classificationLebanonLiberiaLithuaniaLow & middle incomeLow incomeLower middle incomeLuxembourgMacao SAR, ChinaMacedonia, FYRMadagascarMalawiMalaysiaMaliMaltaMauritaniaMauritiusMexicoMiddle East & North AfricaMiddle East & North Africa (excluding high income)Middle East & North Africa (IDA & IBRD countries)Middle incomeMoldovaMongoliaMontenegroMoroccoMozambiqueNamibiaNepalNetherlandsNew ZealandNicaraguaNigerNigeriaNorth AmericaNorwayOECD membersOmanOther small statesPakistanPanamaParaguayPeruPhilippinesPolandPortugalPost-demographic dividendPre-demographic dividendPuerto RicoQatarRomaniaRussian FederationRwandaSaudi ArabiaSenegalSerbiaSeychellesSierra LeoneSingaporeSlovak RepublicSloveniaSmall statesSouth AfricaSouth AsiaSouth Asia (IDA & IBRD)South SudanSpainSri LankaSt. Kitts and NevisSt. LuciaSt. Vincent and the GrenadinesSub-Saharan Africa Sub-Saharan Africa (excluding high income)Sub-Saharan Africa (IDA & IBRD countries)SudanSurinameSwazilandSwedenSwitzerlandTajikistanTanzaniaThailandTimor-LesteTogoTongaTrinidad and TobagoTunisiaTurkeyTurkmenistanUgandaUkraineUnited Arab EmiratesUnited KingdomUnited StatesUpper middle incomeUruguayUzbekistanVanuatuVenezuela, RBVietnamWest Bank and GazaWorldYemen, Rep.ZambiaZimbabwe Timeline:
This timeline shows a graph from 1966 to 2014 of Tunisia. No data until 1965. Number of actual observations by date: 49.
Source name:
World Development Indicators
Source organization:
World Bank national accounts data, and OECD National Accounts data files.
Categories, topics:
Economy & Growth
Last updated:
apr 23, 2017
Indicators value changes by year
Minimum:
2.217 bln
jan 1, 1971
Maximum:
12.314 bln
jan 1, 2014
At the date of observation
Value
Absolute change
Change from previous value
jan 1, 1966
2.293 bln
+2.293 bln
0.0%
jan 1, 1967
2.261 bln
-31.736 mln
-1.38%
jan 1, 1968
2.361 bln
+99.277 mln
4.39%
jan 1, 1969
2.325 bln
-35.805 mln
-1.52%
jan 1, 1970
2.285 bln
-39.711 mln
-1.71%
jan 1, 1971
2.217 bln
-67.541 mln
-2.96%
jan 1, 1972
2.318 bln
+100.416 mln
4.53%
jan 1, 1973
2.95 bln
+632.443 mln
27.29%
jan 1, 1974
2.451 bln
-499.64 mln
-16.94%
jan 1, 1975
3.024 bln
+573.691 mln
23.41%
jan 1, 1976
2.992 bln
-32.387 mln
-1.07%
jan 1, 1977
3.302 bln
+309.874 mln
10.36%
jan 1, 1978
3.369 bln
+66.89 mln
2.03%
jan 1, 1979
3.733 bln
+363.907 mln
10.8%
jan 1, 1980
3.967 bln
+234.033 mln
6.27%
jan 1, 1981
4.004 bln
+37.269 mln
0.94%
jan 1, 1982
4.606 bln
+602.009 mln
15.04%
jan 1, 1983
4.574 bln
-31.573 mln
-0.69%
jan 1, 1984
4.474 bln
-99.928 mln
-2.18%
jan 1, 1985
4.863 bln
+388.97 mln
8.69%
jan 1, 1986
4.251 bln
-612.262 mln
-12.59%
jan 1, 1987
3.456 bln
-794.867 mln
-18.7%
jan 1, 1988
3.396 bln
-60.543 mln
-1.75%
jan 1, 1989
2.98 bln
-415.336 mln
-12.23%
jan 1, 1990
3.925 bln
+944.759 mln
31.7%
jan 1, 1991
4.765 bln
+839.46 mln
21.39%
jan 1, 1992
4.734 bln
-30.597 mln
-0.64%
jan 1, 1993
5.671 bln
+936.458 mln
19.78%
jan 1, 1994
5.541 bln
-129.711 mln
-2.29%
jan 1, 1995
4.832 bln
-708.447 mln
-12.79%
jan 1, 1996
5.075 bln
+242.984 mln
5.03%
jan 1, 1997
5.631 bln
+555.3 mln
10.94%
jan 1, 1998
5.925 bln
+294.739 mln
5.23%
jan 1, 1999
6.187 bln
+261.991 mln
4.42%
jan 1, 2000
6.433 bln
+245.642 mln
3.97%
jan 1, 2001
6.6 bln
+167.054 mln
2.6%
jan 1, 2002
7.062 bln
+461.755 mln
7.0%
jan 1, 2003
6.687 bln
-375.06 mln
-5.31%
jan 1, 2004
7.088 bln
+401.598 mln
6.01%
jan 1, 2005
7.382 bln
+293.579 mln
4.14%
jan 1, 2006
6.954 bln
-428.251 mln
-5.8%
jan 1, 2007
7.745 bln
+790.96 mln
11.37%
jan 1, 2008
8.654 bln
+908.895 mln
11.74%
jan 1, 2009
9.532 bln
+878.486 mln
10.15%
jan 1, 2010
10.648 bln
+1.116 bln
11.7%
jan 1, 2011
11.767 bln
+1.12 bln
10.51%
jan 1, 2012
10.66 bln
-1.107 bln
-9.41%
jan 1, 2013
11.629 bln
+968.533 mln
9.09%
jan 1, 2014
12.314 bln
+685.709 mln
5.9%
Ranking of countries by current statistics by years


Comments: