29
/
en
AIzaSyAYiBZKx7MnpbEhh9jyipgxe19OcubqV5w
April 1, 2024
167538
Kenya
KEN
true
2
1
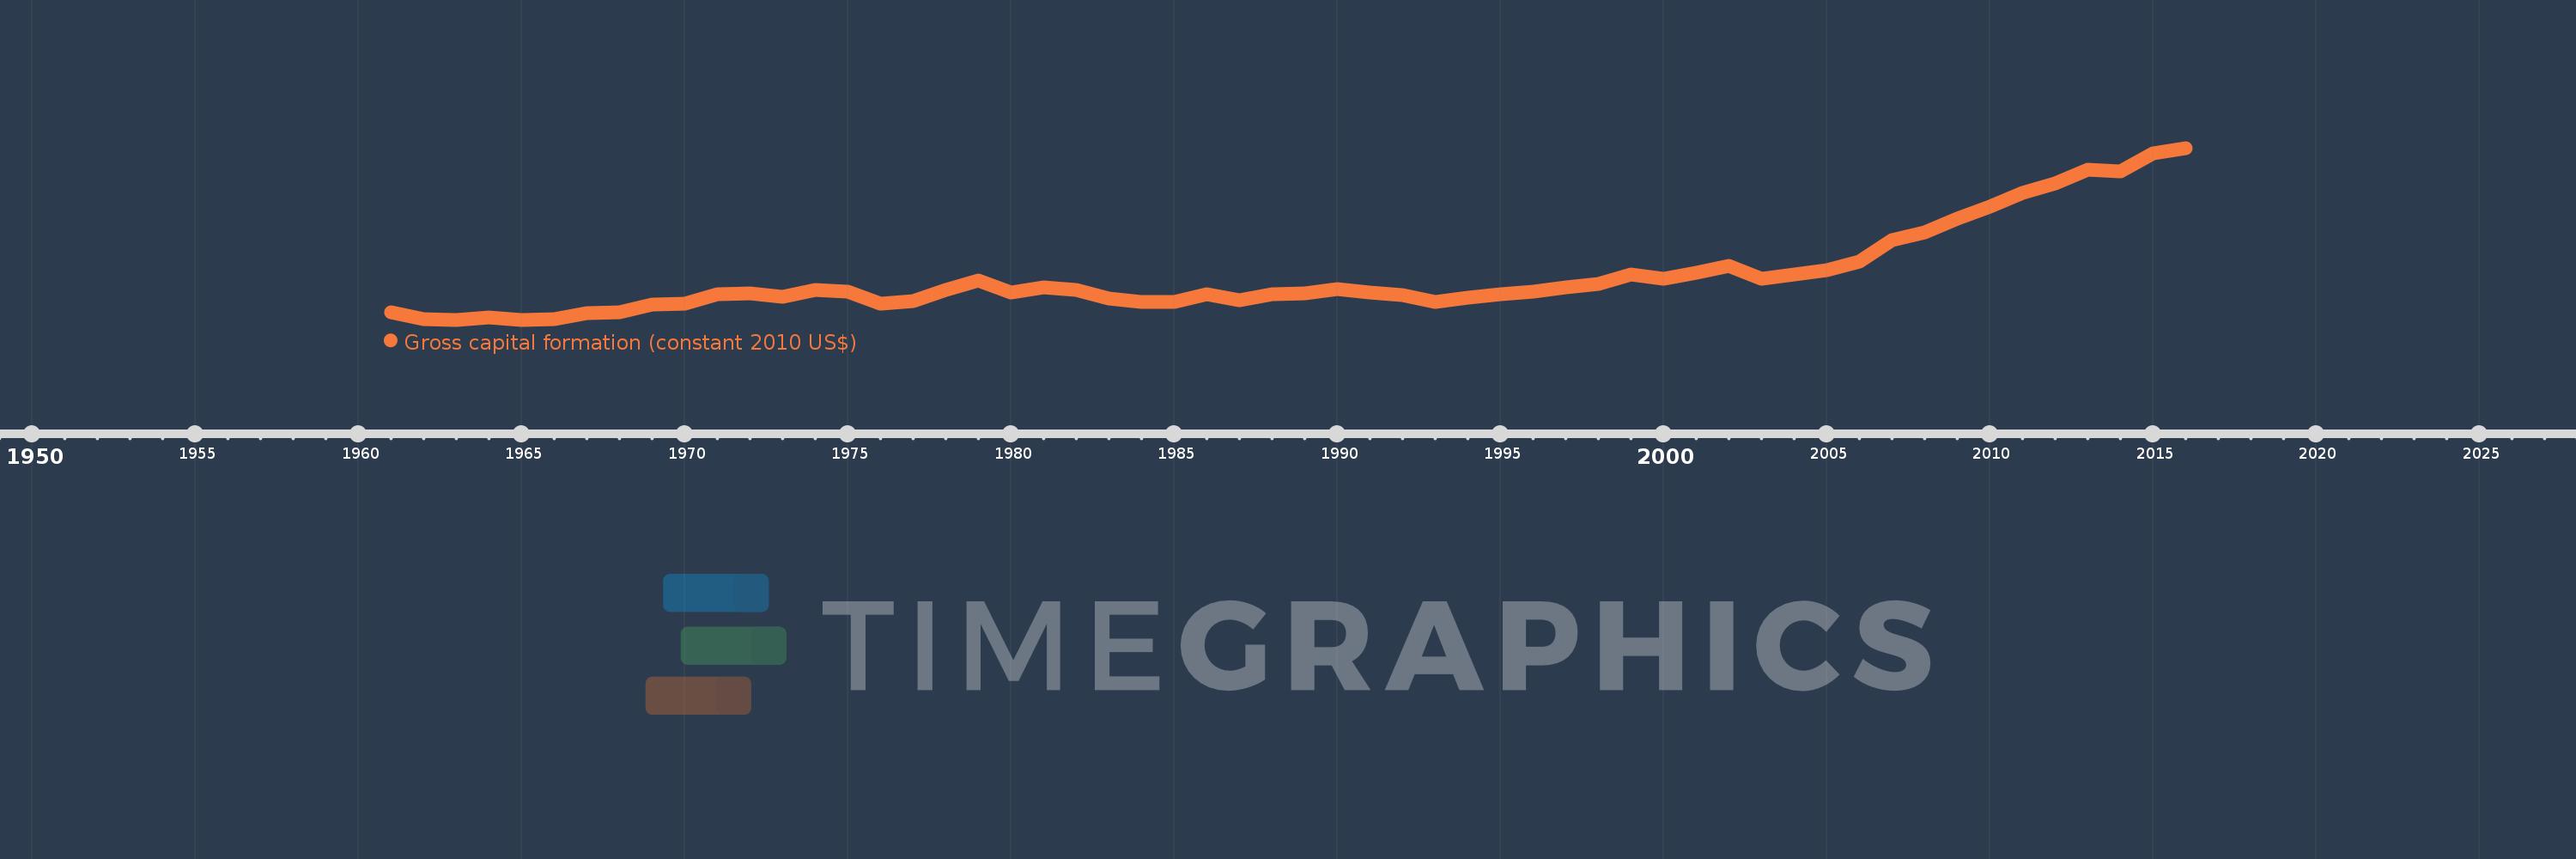
Gross capital formation (constant 2010 US$)
2016,2015,2014,2013,2012,2011,2010,2009,2008,2007,2006,2005,2004,2003,2002,2001,2000,1999,1998,1997,1996,1995,1994,1993,1992,1991,1990,1989,1988,1987,1986,1985,1984,1983,1982,1981,1980,1979,1978,1977,1976,1975,1974,1973,1972,1971,1970,1969,1968,1967,1966,1965,1964,1963,1962,1961
This statistics in other country:
AfghanistanAlbaniaAlgeriaAngolaAntigua and BarbudaArab WorldArgentinaArmeniaArubaAustraliaAustriaAzerbaijanBahamas, TheBahrainBangladeshBarbadosBelarusBelgiumBelizeBeninBermudaBhutanBoliviaBosnia and HerzegovinaBotswanaBrazilBrunei DarussalamBulgariaBurkina FasoBurundiCabo VerdeCambodiaCameroonCanadaCaribbean small statesCentral African RepublicCentral Europe and the BalticsChadChileChinaColombiaComorosCongo, Dem. Rep.Congo, Rep.Cote d'IvoireCroatiaCubaCyprusCzech RepublicDenmarkDominicaDominican RepublicEarly-demographic dividendEast Asia & PacificEast Asia & Pacific (excluding high income)East Asia & Pacific (IDA & IBRD countries)EcuadorEgypt, Arab Rep.El SalvadorEquatorial GuineaEritreaEstoniaEthiopiaEuro areaEurope & Central AsiaEurope & Central Asia (excluding high income)Europe & Central Asia (IDA & IBRD countries)European UnionFaroe IslandsFinlandFragile and conflict affected situationsFranceGabonGambia, TheGeorgiaGermanyGhanaGreeceGrenadaGuatemalaGuineaGuinea-BissauGuyanaHaitiHeavily indebted poor countries (HIPC)High incomeHondurasHong Kong SAR, ChinaHungaryIBRD onlyIcelandIDA & IBRD totalIDA blendIDA onlyIDA totalIndiaIndonesiaIran, Islamic Rep.IraqIrelandIsraelItalyJamaicaJapanJordanKazakhstanKenyaKorea, Rep.KosovoKuwaitKyrgyz RepublicLao PDRLate-demographic dividendLatin America & Caribbean Latin America & Caribbean (excluding high income)Latin America & the Caribbean (IDA & IBRD countries)LatviaLeast developed countries: UN classificationLebanonLiberiaLithuaniaLow & middle incomeLow incomeLower middle incomeLuxembourgMacao SAR, ChinaMacedonia, FYRMadagascarMalawiMalaysiaMaliMaltaMauritaniaMauritiusMexicoMiddle East & North AfricaMiddle East & North Africa (excluding high income)Middle East & North Africa (IDA & IBRD countries)Middle incomeMoldovaMongoliaMontenegroMoroccoMozambiqueNamibiaNepalNetherlandsNew ZealandNicaraguaNigerNigeriaNorth AmericaNorwayOECD membersOmanOther small statesPakistanPanamaParaguayPeruPhilippinesPolandPortugalPost-demographic dividendPre-demographic dividendPuerto RicoQatarRomaniaRussian FederationRwandaSaudi ArabiaSenegalSerbiaSeychellesSierra LeoneSingaporeSlovak RepublicSloveniaSmall statesSouth AfricaSouth AsiaSouth Asia (IDA & IBRD)South SudanSpainSri LankaSt. Kitts and NevisSt. LuciaSt. Vincent and the GrenadinesSub-Saharan Africa Sub-Saharan Africa (excluding high income)Sub-Saharan Africa (IDA & IBRD countries)SudanSurinameSwazilandSwedenSwitzerlandTajikistanTanzaniaThailandTimor-LesteTogoTongaTrinidad and TobagoTunisiaTurkeyTurkmenistanUgandaUkraineUnited Arab EmiratesUnited KingdomUnited StatesUpper middle incomeUruguayUzbekistanVanuatuVenezuela, RBVietnamWest Bank and GazaWorldYemen, Rep.ZambiaZimbabwe Timeline:
This timeline shows a graph from 1961 to 2016 of Kenya. No data until 1960. Number of actual observations by date: 56.
Source name:
World Development Indicators
Source organization:
World Bank national accounts data, and OECD National Accounts data files.
Categories, topics:
Economy & Growth
Last updated:
apr 23, 2017
Indicators value changes by year
Minimum:
640.427 mln
jan 1, 1963
Maximum:
11.028 bln
jan 1, 2016
At the date of observation
Value
Absolute change
Change from previous value
jan 1, 1961
1.068 bln
+1.068 bln
0.0%
jan 1, 1962
692.178 mln
-375.799 mln
-35.19%
jan 1, 1963
640.427 mln
-51.751 mln
-7.48%
jan 1, 1964
765.155 mln
+124.727 mln
19.48%
jan 1, 1965
644.076 mln
-121.079 mln
-15.82%
jan 1, 1966
693.276 mln
+49.2 mln
7.64%
jan 1, 1967
1.035 bln
+341.224 mln
49.22%
jan 1, 1968
1.104 bln
+69.847 mln
6.75%
jan 1, 1969
1.551 bln
+446.402 mln
40.42%
jan 1, 1970
1.59 bln
+38.921 mln
2.51%
jan 1, 1971
2.19 bln
+600.083 mln
37.75%
jan 1, 1972
2.221 bln
+30.822 mln
1.41%
jan 1, 1973
2.039 bln
-181.314 mln
-8.17%
jan 1, 1974
2.466 bln
+427.001 mln
20.94%
jan 1, 1975
2.333 bln
-132.781 mln
-5.38%
jan 1, 1976
1.598 bln
-735.089 mln
-31.5%
jan 1, 1977
1.789 bln
+190.747 mln
11.93%
jan 1, 1978
2.43 bln
+641.213 mln
35.84%
jan 1, 1979
3.01 bln
+579.925 mln
23.86%
jan 1, 1980
2.273 bln
-737.329 mln
-24.49%
jan 1, 1981
2.583 bln
+310.328 mln
13.65%
jan 1, 1982
2.461 bln
-122.013 mln
-4.72%
jan 1, 1983
1.902 bln
-559.219 mln
-22.72%
jan 1, 1984
1.713 bln
-189.205 mln
-9.95%
jan 1, 1985
1.725 bln
+12.281 mln
0.72%
jan 1, 1986
2.209 bln
+483.513 mln
28.03%
jan 1, 1987
1.803 bln
-405.494 mln
-18.36%
jan 1, 1988
2.204 bln
+401.044 mln
22.24%
jan 1, 1989
2.243 bln
+38.891 mln
1.76%
jan 1, 1990
2.47 bln
+227.295 mln
10.13%
jan 1, 1991
2.298 bln
-172.8 mln
-6.99%
jan 1, 1992
2.117 bln
-180.246 mln
-7.85%
jan 1, 1993
1.731 bln
-385.855 mln
-18.22%
jan 1, 1994
1.991 bln
+259.185 mln
14.97%
jan 1, 1995
2.172 bln
+180.898 mln
9.09%
jan 1, 1996
2.354 bln
+182.5 mln
8.4%
jan 1, 1997
2.589 bln
+235.008 mln
9.98%
jan 1, 1998
2.81 bln
+221.296 mln
8.55%
jan 1, 1999
3.394 bln
+584.083 mln
20.78%
jan 1, 2000
3.118 bln
-276.113 mln
-8.13%
jan 1, 2001
3.465 bln
+346.575 mln
11.11%
jan 1, 2002
3.885 bln
+419.996 mln
12.12%
jan 1, 2003
3.093 bln
-791.518 mln
-20.37%
jan 1, 2004
3.403 bln
+309.51 mln
10.01%
jan 1, 2005
3.662 bln
+259.557 mln
7.63%
jan 1, 2006
4.147 bln
+484.926 mln
13.24%
jan 1, 2007
5.453 bln
+1.305 bln
31.47%
jan 1, 2008
5.898 bln
+444.861 mln
8.16%
jan 1, 2009
6.731 bln
+833.695 mln
14.14%
jan 1, 2010
7.478 bln
+746.694 mln
11.09%
jan 1, 2011
8.294 bln
+815.919 mln
10.91%
jan 1, 2012
8.875 bln
+581.366 mln
7.01%
jan 1, 2013
9.738 bln
+863.073 mln
9.72%
jan 1, 2014
9.616 bln
-122.605 mln
-1.26%
jan 1, 2015
10.725 bln
+1.109 bln
11.53%
jan 1, 2016
11.028 bln
+303.062 mln
2.83%
Ranking of countries by current statistics by years


Comments: