29
/
en
AIzaSyAYiBZKx7MnpbEhh9jyipgxe19OcubqV5w
April 1, 2024
253063
Sudan
SDN
true
2
1
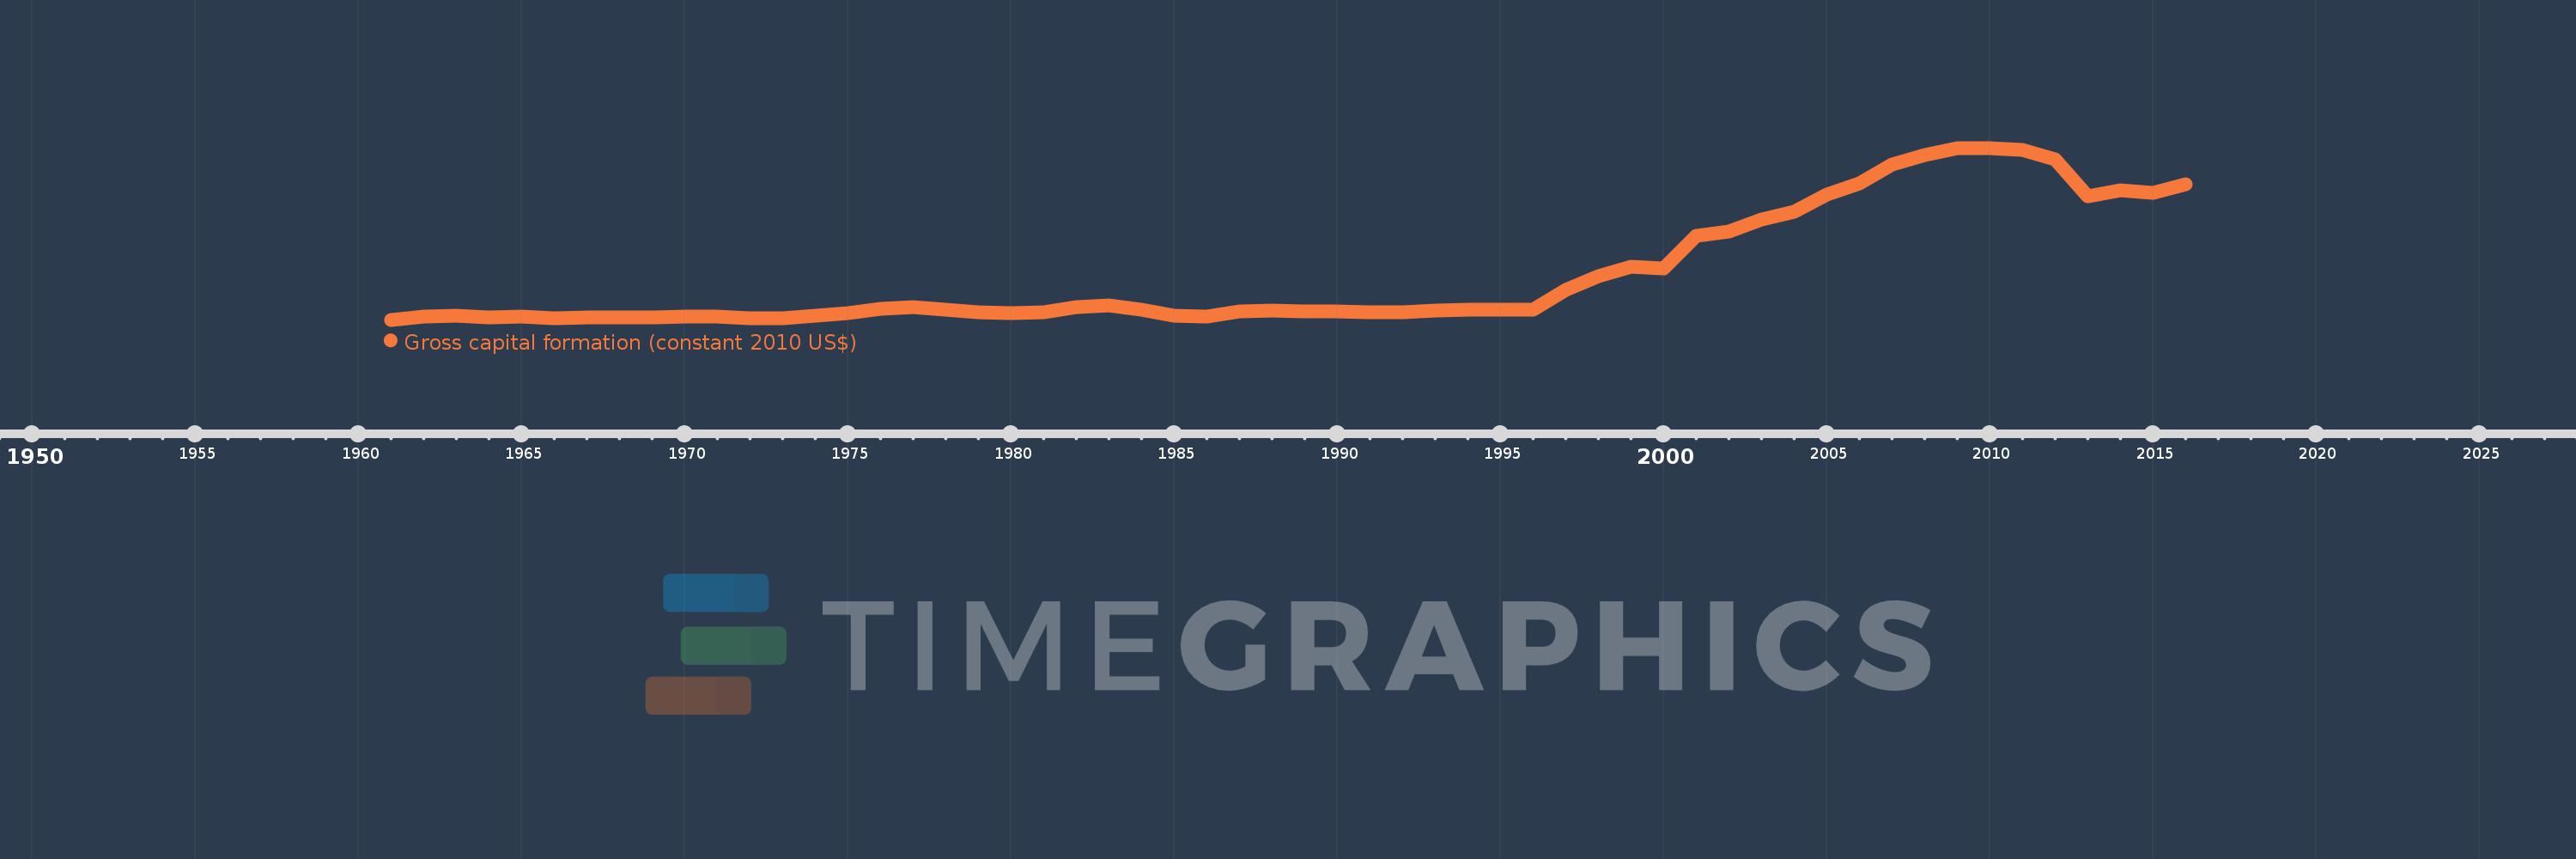
Gross capital formation (constant 2010 US$)
2016,2015,2014,2013,2012,2011,2010,2009,2008,2007,2006,2005,2004,2003,2002,2001,2000,1999,1998,1997,1996,1995,1994,1993,1992,1991,1990,1989,1988,1987,1986,1985,1984,1983,1982,1981,1980,1979,1978,1977,1976,1975,1974,1973,1972,1971,1970,1969,1968,1967,1966,1965,1964,1963,1962,1961
This statistics in other country:
AfghanistanAlbaniaAlgeriaAngolaAntigua and BarbudaArab WorldArgentinaArmeniaArubaAustraliaAustriaAzerbaijanBahamas, TheBahrainBangladeshBarbadosBelarusBelgiumBelizeBeninBermudaBhutanBoliviaBosnia and HerzegovinaBotswanaBrazilBrunei DarussalamBulgariaBurkina FasoBurundiCabo VerdeCambodiaCameroonCanadaCaribbean small statesCentral African RepublicCentral Europe and the BalticsChadChileChinaColombiaComorosCongo, Dem. Rep.Congo, Rep.Cote d'IvoireCroatiaCubaCyprusCzech RepublicDenmarkDominicaDominican RepublicEarly-demographic dividendEast Asia & PacificEast Asia & Pacific (excluding high income)East Asia & Pacific (IDA & IBRD countries)EcuadorEgypt, Arab Rep.El SalvadorEquatorial GuineaEritreaEstoniaEthiopiaEuro areaEurope & Central AsiaEurope & Central Asia (excluding high income)Europe & Central Asia (IDA & IBRD countries)European UnionFaroe IslandsFinlandFragile and conflict affected situationsFranceGabonGambia, TheGeorgiaGermanyGhanaGreeceGrenadaGuatemalaGuineaGuinea-BissauGuyanaHaitiHeavily indebted poor countries (HIPC)High incomeHondurasHong Kong SAR, ChinaHungaryIBRD onlyIcelandIDA & IBRD totalIDA blendIDA onlyIDA totalIndiaIndonesiaIran, Islamic Rep.IraqIrelandIsraelItalyJamaicaJapanJordanKazakhstanKenyaKorea, Rep.KosovoKuwaitKyrgyz RepublicLao PDRLate-demographic dividendLatin America & Caribbean Latin America & Caribbean (excluding high income)Latin America & the Caribbean (IDA & IBRD countries)LatviaLeast developed countries: UN classificationLebanonLiberiaLithuaniaLow & middle incomeLow incomeLower middle incomeLuxembourgMacao SAR, ChinaMacedonia, FYRMadagascarMalawiMalaysiaMaliMaltaMauritaniaMauritiusMexicoMiddle East & North AfricaMiddle East & North Africa (excluding high income)Middle East & North Africa (IDA & IBRD countries)Middle incomeMoldovaMongoliaMontenegroMoroccoMozambiqueNamibiaNepalNetherlandsNew ZealandNicaraguaNigerNigeriaNorth AmericaNorwayOECD membersOmanOther small statesPakistanPanamaParaguayPeruPhilippinesPolandPortugalPost-demographic dividendPre-demographic dividendPuerto RicoQatarRomaniaRussian FederationRwandaSaudi ArabiaSenegalSerbiaSeychellesSierra LeoneSingaporeSlovak RepublicSloveniaSmall statesSouth AfricaSouth AsiaSouth Asia (IDA & IBRD)South SudanSpainSri LankaSt. Kitts and NevisSt. LuciaSt. Vincent and the GrenadinesSub-Saharan Africa Sub-Saharan Africa (excluding high income)Sub-Saharan Africa (IDA & IBRD countries)SudanSurinameSwazilandSwedenSwitzerlandTajikistanTanzaniaThailandTimor-LesteTogoTongaTrinidad and TobagoTunisiaTurkeyTurkmenistanUgandaUkraineUnited Arab EmiratesUnited KingdomUnited StatesUpper middle incomeUruguayUzbekistanVanuatuVenezuela, RBVietnamWest Bank and GazaWorldYemen, Rep.ZambiaZimbabwe Timeline:
This timeline shows a graph from 1961 to 2016 of Sudan. No data until 1960. Number of actual observations by date: 56.
Source name:
World Development Indicators
Source organization:
World Bank national accounts data, and OECD National Accounts data files.
Categories, topics:
Economy & Growth
Last updated:
apr 23, 2017
Indicators value changes by year
Minimum:
422.392 mln
jan 1, 1961
Maximum:
15.266 bln
jan 1, 2009
At the date of observation
Value
Absolute change
Change from previous value
jan 1, 1961
422.392 mln
+422.392 mln
0.0%
jan 1, 1962
672.029 mln
+249.637 mln
59.1%
jan 1, 1963
753.432 mln
+81.403 mln
12.11%
jan 1, 1964
627.71 mln
-125.723 mln
-16.69%
jan 1, 1965
667.507 mln
+39.797 mln
6.34%
jan 1, 1966
557.16 mln
-110.347 mln
-16.53%
jan 1, 1967
611.942 mln
+54.782 mln
9.83%
jan 1, 1968
620.5 mln
+8.558 mln
1.4%
jan 1, 1969
632.493 mln
+11.993 mln
1.93%
jan 1, 1970
660.336 mln
+27.843 mln
4.4%
jan 1, 1971
668.05 mln
+7.714 mln
1.17%
jan 1, 1972
565.236 mln
-102.814 mln
-15.39%
jan 1, 1973
532.029 mln
-33.207 mln
-5.87%
jan 1, 1974
783.761 mln
+251.731 mln
47.32%
jan 1, 1975
1.03 bln
+245.886 mln
31.37%
jan 1, 1976
1.366 bln
+336.225 mln
32.65%
jan 1, 1977
1.539 bln
+172.904 mln
12.66%
jan 1, 1978
1.292 bln
-247.151 mln
-16.06%
jan 1, 1979
1.069 bln
-222.261 mln
-17.21%
jan 1, 1980
1.016 bln
-53.335 mln
-4.99%
jan 1, 1981
1.071 bln
+55.204 mln
5.43%
jan 1, 1982
1.507 bln
+436.146 mln
40.71%
jan 1, 1983
1.663 bln
+155.185 mln
10.3%
jan 1, 1984
1.309 bln
-354.003 mln
-21.29%
jan 1, 1985
794.609 mln
-513.949 mln
-39.28%
jan 1, 1986
716.504 mln
-78.105 mln
-9.83%
jan 1, 1987
1.165 bln
+448.621 mln
62.61%
jan 1, 1988
1.209 bln
+43.572 mln
3.74%
jan 1, 1989
1.168 bln
-40.198 mln
-3.33%
jan 1, 1990
1.149 bln
-19.104 mln
-1.63%
jan 1, 1991
1.065 bln
-84.433 mln
-7.35%
jan 1, 1992
1.094 bln
+28.98 mln
2.72%
jan 1, 1993
1.21 bln
+116.435 mln
10.64%
jan 1, 1994
1.267 bln
+56.406 mln
4.66%
jan 1, 1995
1.306 bln
+39.372 mln
3.11%
jan 1, 1996
1.32 bln
+14.046 mln
1.08%
jan 1, 1997
2.999 bln
+1.678 bln
127.14%
jan 1, 1998
4.219 bln
+1.22 bln
40.69%
jan 1, 1999
5.032 bln
+813.479 mln
19.28%
jan 1, 2000
4.866 bln
-166.698 mln
-3.31%
jan 1, 2001
7.686 bln
+2.82 bln
57.96%
jan 1, 2002
8.027 bln
+341.196 mln
4.44%
jan 1, 2003
9.056 bln
+1.029 bln
12.82%
jan 1, 2004
9.759 bln
+703.4 mln
7.77%
jan 1, 2005
11.248 bln
+1.489 bln
15.26%
jan 1, 2006
12.182 bln
+933.301 mln
8.3%
jan 1, 2007
13.837 bln
+1.655 bln
13.58%
jan 1, 2008
14.68 bln
+843.696 mln
6.1%
jan 1, 2009
15.266 bln
+585.28 mln
3.99%
jan 1, 2010
15.245 bln
-20.175 mln
-0.13%
jan 1, 2011
15.126 bln
-119.475 mln
-0.78%
jan 1, 2012
14.269 bln
-857.046 mln
-5.67%
jan 1, 2013
11.115 bln
-3.153 bln
-22.1%
jan 1, 2014
11.627 bln
+511.719 mln
4.6%
jan 1, 2015
11.375 bln
-251.927 mln
-2.17%
jan 1, 2016
12.112 bln
+736.847 mln
6.48%
Ranking of countries by current statistics by years


Comments: