29
/
en
AIzaSyAYiBZKx7MnpbEhh9jyipgxe19OcubqV5w
April 1, 2024
272286
Uganda
UGA
true
2
1
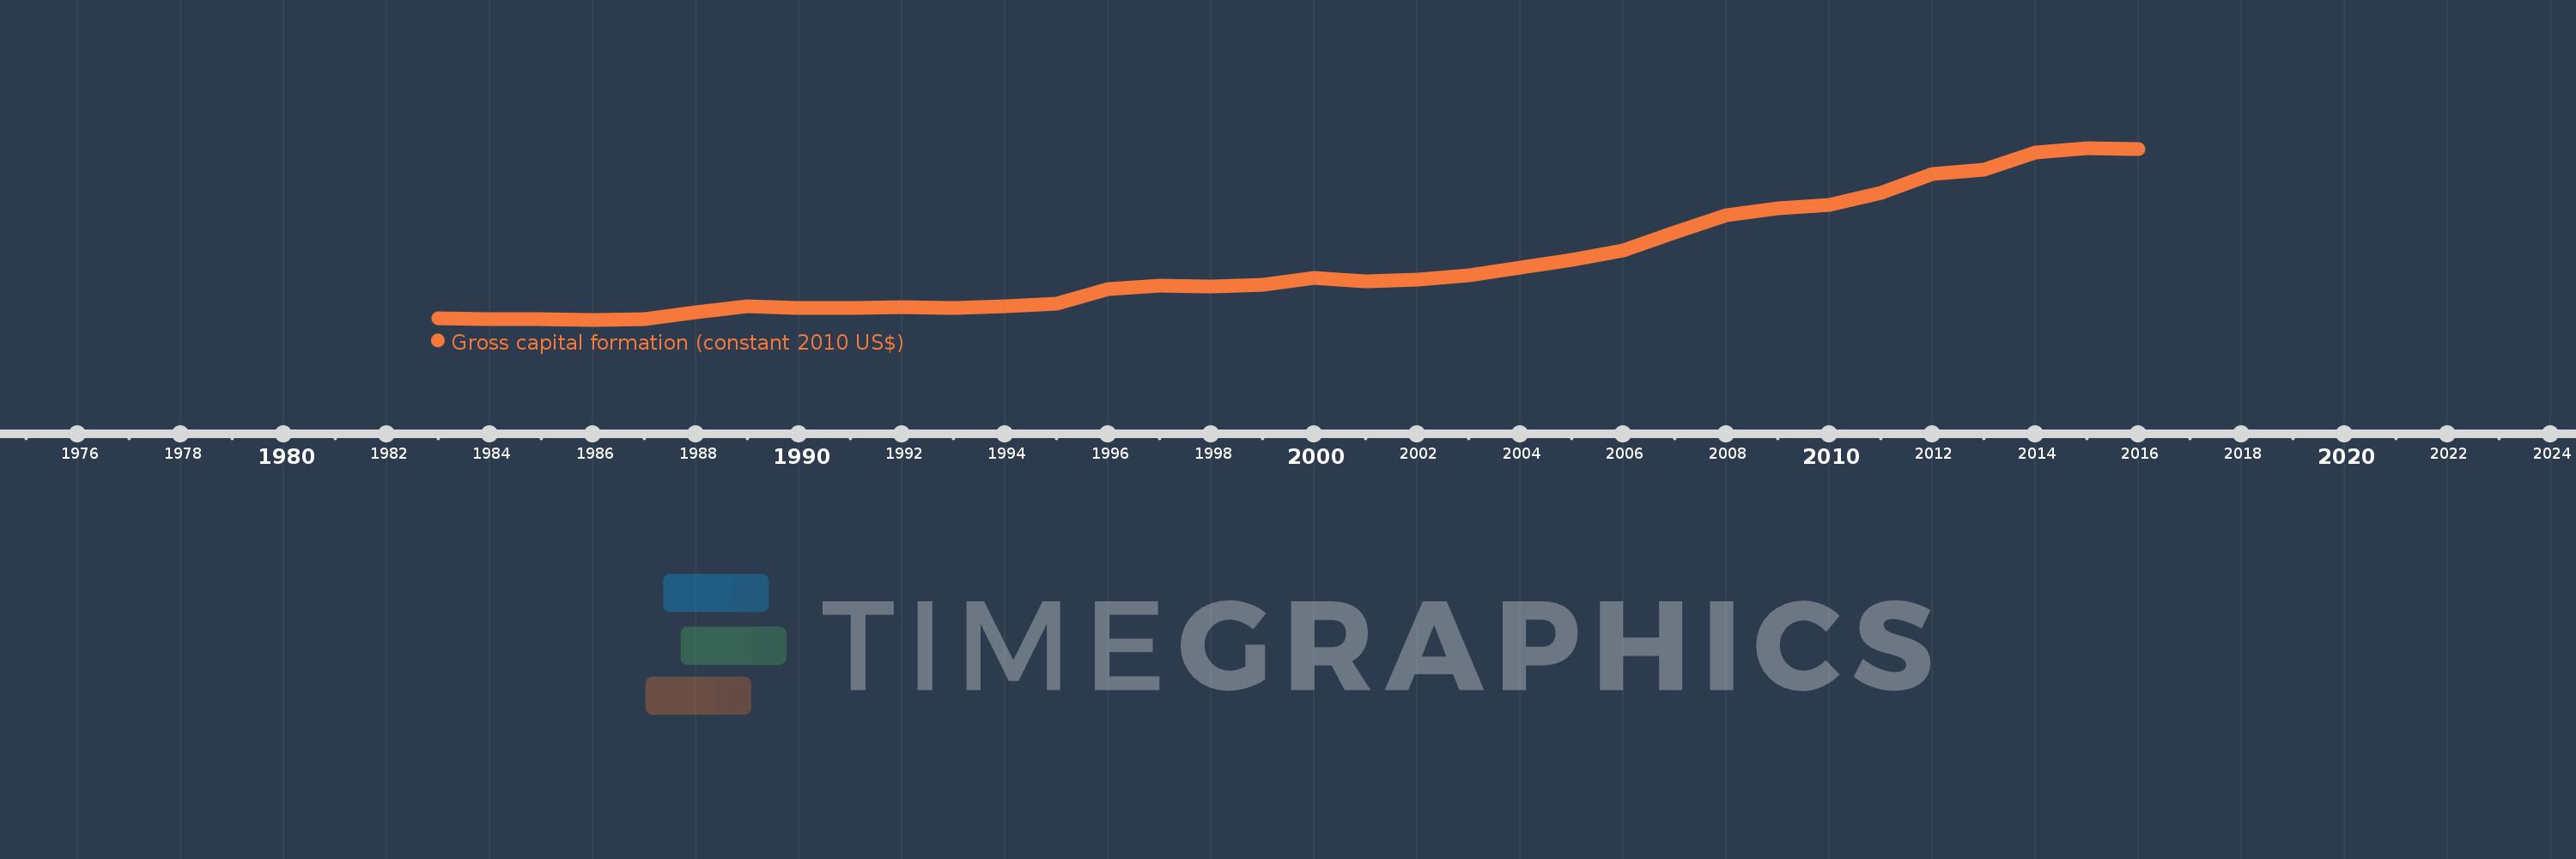
Gross capital formation (constant 2010 US$)
2016,2015,2014,2013,2012,2011,2010,2009,2008,2007,2006,2005,2004,2003,2002,2001,2000,1999,1998,1997,1996,1995,1994,1993,1992,1991,1990,1989,1988,1987,1986,1985,1984,1983
This statistics in other country:
AfghanistanAlbaniaAlgeriaAngolaAntigua and BarbudaArab WorldArgentinaArmeniaArubaAustraliaAustriaAzerbaijanBahamas, TheBahrainBangladeshBarbadosBelarusBelgiumBelizeBeninBermudaBhutanBoliviaBosnia and HerzegovinaBotswanaBrazilBrunei DarussalamBulgariaBurkina FasoBurundiCabo VerdeCambodiaCameroonCanadaCaribbean small statesCentral African RepublicCentral Europe and the BalticsChadChileChinaColombiaComorosCongo, Dem. Rep.Congo, Rep.Cote d'IvoireCroatiaCubaCyprusCzech RepublicDenmarkDominicaDominican RepublicEarly-demographic dividendEast Asia & PacificEast Asia & Pacific (excluding high income)East Asia & Pacific (IDA & IBRD countries)EcuadorEgypt, Arab Rep.El SalvadorEquatorial GuineaEritreaEstoniaEthiopiaEuro areaEurope & Central AsiaEurope & Central Asia (excluding high income)Europe & Central Asia (IDA & IBRD countries)European UnionFaroe IslandsFinlandFragile and conflict affected situationsFranceGabonGambia, TheGeorgiaGermanyGhanaGreeceGrenadaGuatemalaGuineaGuinea-BissauGuyanaHaitiHeavily indebted poor countries (HIPC)High incomeHondurasHong Kong SAR, ChinaHungaryIBRD onlyIcelandIDA & IBRD totalIDA blendIDA onlyIDA totalIndiaIndonesiaIran, Islamic Rep.IraqIrelandIsraelItalyJamaicaJapanJordanKazakhstanKenyaKorea, Rep.KosovoKuwaitKyrgyz RepublicLao PDRLate-demographic dividendLatin America & Caribbean Latin America & Caribbean (excluding high income)Latin America & the Caribbean (IDA & IBRD countries)LatviaLeast developed countries: UN classificationLebanonLiberiaLithuaniaLow & middle incomeLow incomeLower middle incomeLuxembourgMacao SAR, ChinaMacedonia, FYRMadagascarMalawiMalaysiaMaliMaltaMauritaniaMauritiusMexicoMiddle East & North AfricaMiddle East & North Africa (excluding high income)Middle East & North Africa (IDA & IBRD countries)Middle incomeMoldovaMongoliaMontenegroMoroccoMozambiqueNamibiaNepalNetherlandsNew ZealandNicaraguaNigerNigeriaNorth AmericaNorwayOECD membersOmanOther small statesPakistanPanamaParaguayPeruPhilippinesPolandPortugalPost-demographic dividendPre-demographic dividendPuerto RicoQatarRomaniaRussian FederationRwandaSaudi ArabiaSenegalSerbiaSeychellesSierra LeoneSingaporeSlovak RepublicSloveniaSmall statesSouth AfricaSouth AsiaSouth Asia (IDA & IBRD)South SudanSpainSri LankaSt. Kitts and NevisSt. LuciaSt. Vincent and the GrenadinesSub-Saharan Africa Sub-Saharan Africa (excluding high income)Sub-Saharan Africa (IDA & IBRD countries)SudanSurinameSwazilandSwedenSwitzerlandTajikistanTanzaniaThailandTimor-LesteTogoTongaTrinidad and TobagoTunisiaTurkeyTurkmenistanUgandaUkraineUnited Arab EmiratesUnited KingdomUnited StatesUpper middle incomeUruguayUzbekistanVanuatuVenezuela, RBVietnamWest Bank and GazaWorldYemen, Rep.ZambiaZimbabwe Timeline:
This timeline shows a graph from 1983 to 2016 of Uganda. No data until 1982. Number of actual observations by date: 34.
Source name:
World Development Indicators
Source organization:
World Bank national accounts data, and OECD National Accounts data files.
Categories, topics:
Economy & Growth
Last updated:
apr 23, 2017
Indicators value changes by year
Minimum:
643.496 mln
jan 1, 1986
Maximum:
6.754 bln
jan 1, 2015
At the date of observation
Value
Absolute change
Change from previous value
jan 1, 1983
680.936 mln
+680.936 mln
0.0%
jan 1, 1984
660.56 mln
-20.376 mln
-2.99%
jan 1, 1985
660.036 mln
-524.022K
-0.08%
jan 1, 1986
643.496 mln
-16.54 mln
-2.51%
jan 1, 1987
659.42 mln
+15.925 mln
2.47%
jan 1, 1988
902.518 mln
+243.097 mln
36.87%
jan 1, 1989
1.112 bln
+209.91 mln
23.26%
jan 1, 1990
1.059 bln
-53.764 mln
-4.83%
jan 1, 1991
1.074 bln
+15.769 mln
1.49%
jan 1, 1992
1.105 bln
+30.835 mln
2.87%
jan 1, 1993
1.056 bln
-49.541 mln
-4.48%
jan 1, 1994
1.114 bln
+58.556 mln
5.55%
jan 1, 1995
1.229 bln
+114.843 mln
10.31%
jan 1, 1996
1.745 bln
+515.713 mln
41.96%
jan 1, 1997
1.866 bln
+120.912 mln
6.93%
jan 1, 1998
1.816 bln
-49.575 mln
-2.66%
jan 1, 1999
1.884 bln
+67.446 mln
3.71%
jan 1, 2000
2.147 bln
+262.931 mln
13.96%
jan 1, 2001
1.997 bln
-149.99 mln
-6.99%
jan 1, 2002
2.075 bln
+78.39 mln
3.93%
jan 1, 2003
2.21 bln
+135.275 mln
6.52%
jan 1, 2004
2.509 bln
+298.755 mln
13.52%
jan 1, 2005
2.775 bln
+266.31 mln
10.61%
jan 1, 2006
3.121 bln
+345.73 mln
12.46%
jan 1, 2007
3.756 bln
+635.061 mln
20.35%
jan 1, 2008
4.356 bln
+599.903 mln
15.97%
jan 1, 2009
4.618 bln
+261.937 mln
6.01%
jan 1, 2010
4.731 bln
+113.53 mln
2.46%
jan 1, 2011
5.159 bln
+427.398 mln
9.03%
jan 1, 2012
5.83 bln
+671.296 mln
13.01%
jan 1, 2013
5.99 bln
+160.068 mln
2.75%
jan 1, 2014
6.579 bln
+588.954 mln
9.83%
jan 1, 2015
6.754 bln
+174.363 mln
2.65%
jan 1, 2016
6.72 bln
-33.774 mln
-0.5%
Ranking of countries by current statistics by years


Comments: