29
/
en
AIzaSyAYiBZKx7MnpbEhh9jyipgxe19OcubqV5w
April 1, 2024
104917
Chile
CHL
true
2
1
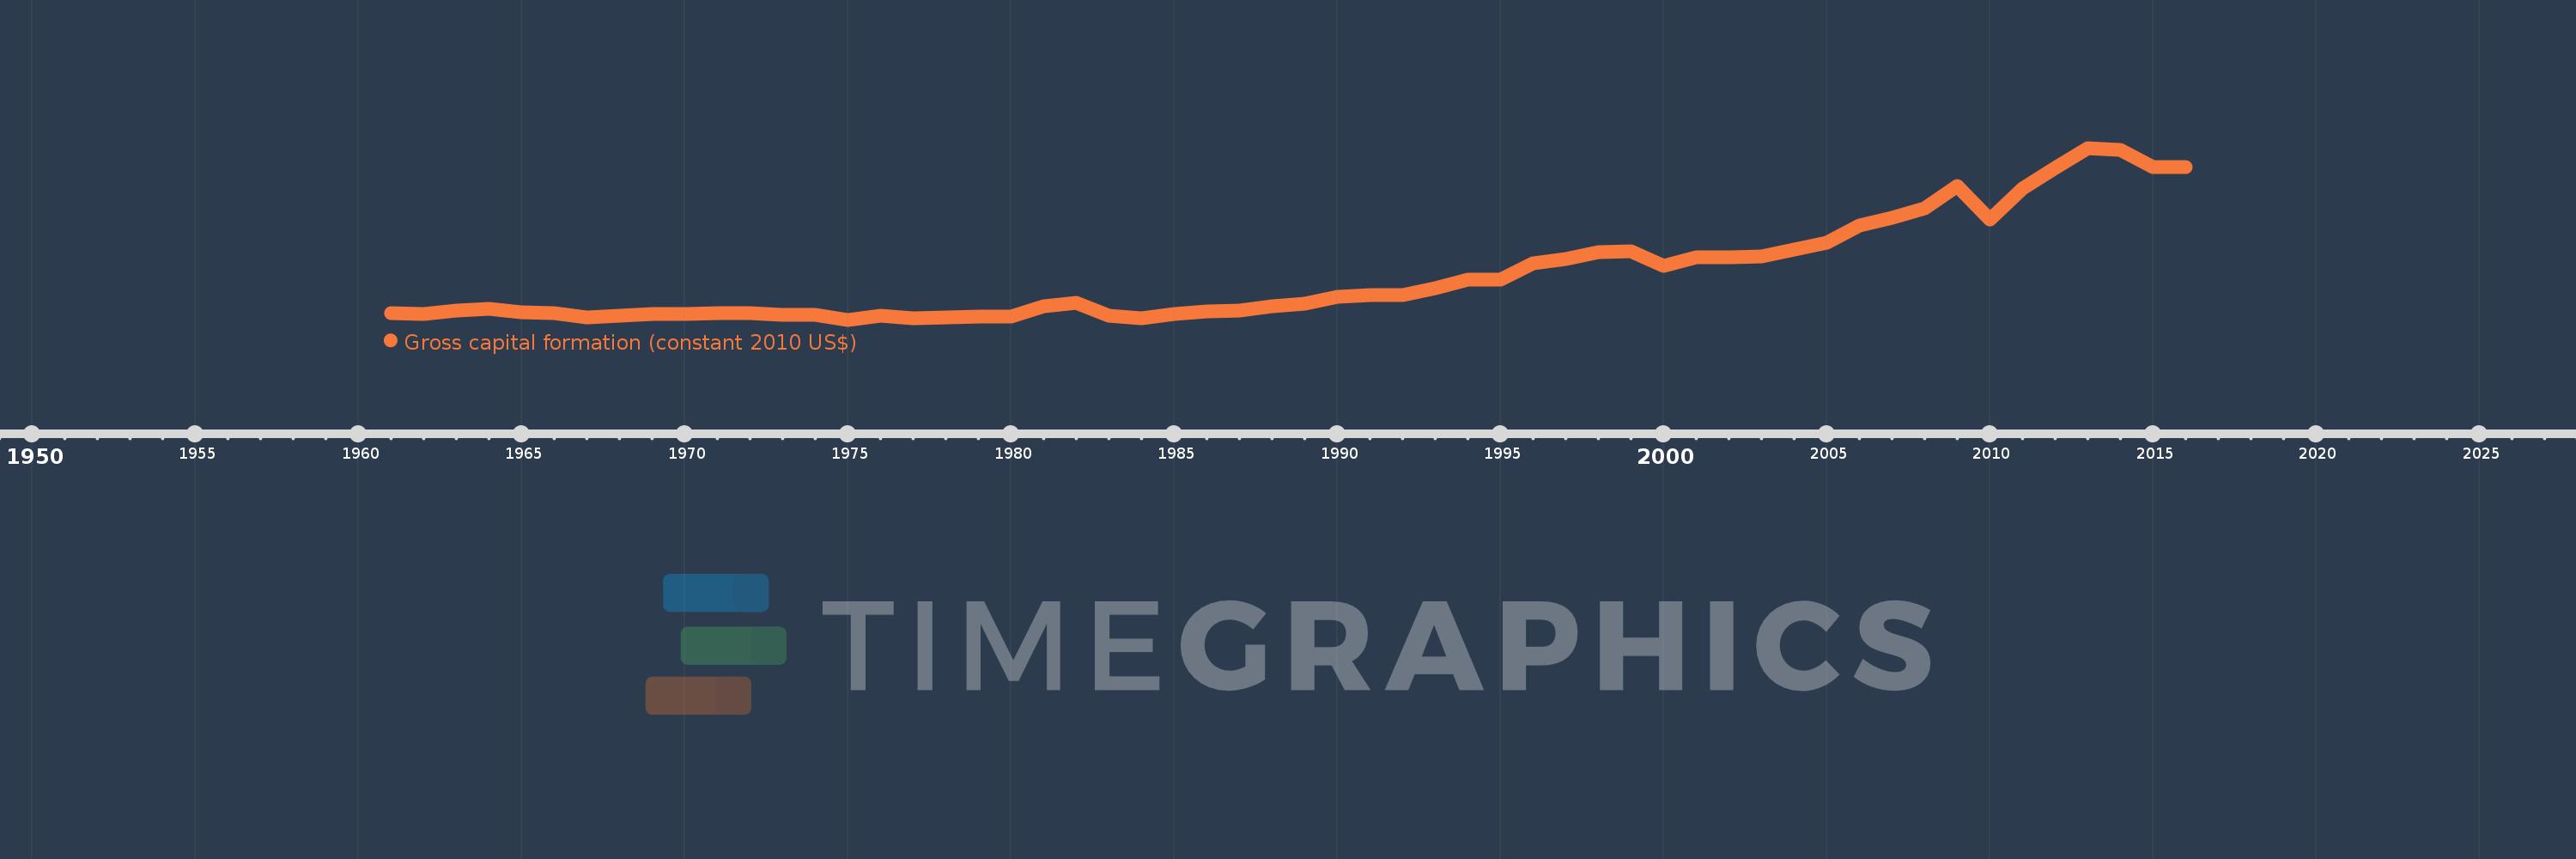
Gross capital formation (constant 2010 US$)
2016,2015,2014,2013,2012,2011,2010,2009,2008,2007,2006,2005,2004,2003,2002,2001,2000,1999,1998,1997,1996,1995,1994,1993,1992,1991,1990,1989,1988,1987,1986,1985,1984,1983,1982,1981,1980,1979,1978,1977,1976,1975,1974,1973,1972,1971,1970,1969,1968,1967,1966,1965,1964,1963,1962,1961
This statistics in other country:
AfghanistanAlbaniaAlgeriaAngolaAntigua and BarbudaArab WorldArgentinaArmeniaArubaAustraliaAustriaAzerbaijanBahamas, TheBahrainBangladeshBarbadosBelarusBelgiumBelizeBeninBermudaBhutanBoliviaBosnia and HerzegovinaBotswanaBrazilBrunei DarussalamBulgariaBurkina FasoBurundiCabo VerdeCambodiaCameroonCanadaCaribbean small statesCentral African RepublicCentral Europe and the BalticsChadChileChinaColombiaComorosCongo, Dem. Rep.Congo, Rep.Cote d'IvoireCroatiaCubaCyprusCzech RepublicDenmarkDominicaDominican RepublicEarly-demographic dividendEast Asia & PacificEast Asia & Pacific (excluding high income)East Asia & Pacific (IDA & IBRD countries)EcuadorEgypt, Arab Rep.El SalvadorEquatorial GuineaEritreaEstoniaEthiopiaEuro areaEurope & Central AsiaEurope & Central Asia (excluding high income)Europe & Central Asia (IDA & IBRD countries)European UnionFaroe IslandsFinlandFragile and conflict affected situationsFranceGabonGambia, TheGeorgiaGermanyGhanaGreeceGrenadaGuatemalaGuineaGuinea-BissauGuyanaHaitiHeavily indebted poor countries (HIPC)High incomeHondurasHong Kong SAR, ChinaHungaryIBRD onlyIcelandIDA & IBRD totalIDA blendIDA onlyIDA totalIndiaIndonesiaIran, Islamic Rep.IraqIrelandIsraelItalyJamaicaJapanJordanKazakhstanKenyaKorea, Rep.KosovoKuwaitKyrgyz RepublicLao PDRLate-demographic dividendLatin America & Caribbean Latin America & Caribbean (excluding high income)Latin America & the Caribbean (IDA & IBRD countries)LatviaLeast developed countries: UN classificationLebanonLiberiaLithuaniaLow & middle incomeLow incomeLower middle incomeLuxembourgMacao SAR, ChinaMacedonia, FYRMadagascarMalawiMalaysiaMaliMaltaMauritaniaMauritiusMexicoMiddle East & North AfricaMiddle East & North Africa (excluding high income)Middle East & North Africa (IDA & IBRD countries)Middle incomeMoldovaMongoliaMontenegroMoroccoMozambiqueNamibiaNepalNetherlandsNew ZealandNicaraguaNigerNigeriaNorth AmericaNorwayOECD membersOmanOther small statesPakistanPanamaParaguayPeruPhilippinesPolandPortugalPost-demographic dividendPre-demographic dividendPuerto RicoQatarRomaniaRussian FederationRwandaSaudi ArabiaSenegalSerbiaSeychellesSierra LeoneSingaporeSlovak RepublicSloveniaSmall statesSouth AfricaSouth AsiaSouth Asia (IDA & IBRD)South SudanSpainSri LankaSt. Kitts and NevisSt. LuciaSt. Vincent and the GrenadinesSub-Saharan Africa Sub-Saharan Africa (excluding high income)Sub-Saharan Africa (IDA & IBRD countries)SudanSurinameSwazilandSwedenSwitzerlandTajikistanTanzaniaThailandTimor-LesteTogoTongaTrinidad and TobagoTunisiaTurkeyTurkmenistanUgandaUkraineUnited Arab EmiratesUnited KingdomUnited StatesUpper middle incomeUruguayUzbekistanVanuatuVenezuela, RBVietnamWest Bank and GazaWorldYemen, Rep.ZambiaZimbabwe Timeline:
This timeline shows a graph from 1961 to 2016 of Chile. No data until 1960. Number of actual observations by date: 56.
Source name:
World Development Indicators
Source organization:
World Bank national accounts data, and OECD National Accounts data files.
Categories, topics:
Economy & Growth
Last updated:
apr 23, 2017
Indicators value changes by year
Minimum:
2.651 bln
jan 1, 1975
Maximum:
62.548 bln
jan 1, 2013
At the date of observation
Value
Absolute change
Change from previous value
jan 1, 1961
4.929 bln
+4.929 bln
0.0%
jan 1, 1962
4.675 bln
-254.778 mln
-5.17%
jan 1, 1963
5.842 bln
+1.167 bln
24.97%
jan 1, 1964
6.566 bln
+724.198 mln
12.4%
jan 1, 1965
5.329 bln
-1.237 bln
-18.83%
jan 1, 1966
4.86 bln
-469.151 mln
-8.8%
jan 1, 1967
3.464 bln
-1.396 bln
-28.73%
jan 1, 1968
4.177 bln
+712.727 mln
20.58%
jan 1, 1969
4.608 bln
+431.128 mln
10.32%
jan 1, 1970
4.724 bln
+116.804 mln
2.54%
jan 1, 1971
4.92 bln
+195.77 mln
4.14%
jan 1, 1972
4.86 bln
-60.266 mln
-1.22%
jan 1, 1973
4.351 bln
-508.454 mln
-10.46%
jan 1, 1974
4.307 bln
-44.163 mln
-1.01%
jan 1, 1975
2.651 bln
-1.657 bln
-38.46%
jan 1, 1976
4.2 bln
+1.549 bln
58.45%
jan 1, 1977
3.066 bln
-1.134 bln
-27.0%
jan 1, 1978
3.493 bln
+427.082 mln
13.93%
jan 1, 1979
3.858 bln
+364.948 mln
10.45%
jan 1, 1980
3.902 bln
+43.689 mln
1.13%
jan 1, 1981
7.369 bln
+3.467 bln
88.86%
jan 1, 1982
8.514 bln
+1.145 bln
15.54%
jan 1, 1983
4.157 bln
-4.356 bln
-51.17%
jan 1, 1984
3.302 bln
-855.349 mln
-20.57%
jan 1, 1985
4.743 bln
+1.441 bln
43.64%
jan 1, 1986
5.506 bln
+762.302 mln
16.07%
jan 1, 1987
5.884 bln
+378.855 mln
6.88%
jan 1, 1988
7.464 bln
+1.58 bln
26.84%
jan 1, 1989
8.33 bln
+866.257 mln
11.61%
jan 1, 1990
10.548 bln
+2.218 bln
26.62%
jan 1, 1991
11.114 bln
+566.113 mln
5.37%
jan 1, 1992
11.191 bln
+76.642 mln
0.69%
jan 1, 1993
13.628 bln
+2.438 bln
21.78%
jan 1, 1994
16.505 bln
+2.876 bln
21.11%
jan 1, 1995
16.633 bln
+127.767 mln
0.77%
jan 1, 1996
22.322 bln
+5.69 bln
34.21%
jan 1, 1997
23.864 bln
+1.542 bln
6.91%
jan 1, 1998
26.097 bln
+2.233 bln
9.36%
jan 1, 1999
26.66 bln
+562.984 mln
2.16%
jan 1, 2000
21.294 bln
-5.365 bln
-20.13%
jan 1, 2001
24.388 bln
+3.094 bln
14.53%
jan 1, 2002
24.3 bln
-88.008 mln
-0.36%
jan 1, 2003
24.858 bln
+557.919 mln
2.3%
jan 1, 2004
27.021 bln
+2.163 bln
8.7%
jan 1, 2005
29.366 bln
+2.345 bln
8.68%
jan 1, 2006
35.545 bln
+6.179 bln
21.04%
jan 1, 2007
38.144 bln
+2.599 bln
7.31%
jan 1, 2008
41.44 bln
+3.296 bln
8.64%
jan 1, 2009
49.192 bln
+7.752 bln
18.71%
jan 1, 2010
37.642 bln
-11.549 bln
-23.48%
jan 1, 2011
48.481 bln
+10.839 bln
28.79%
jan 1, 2012
55.642 bln
+7.161 bln
14.77%
jan 1, 2013
62.548 bln
+6.905 bln
12.41%
jan 1, 2014
61.722 bln
-825.603 mln
-1.32%
jan 1, 2015
55.739 bln
-5.983 bln
-9.69%
jan 1, 2016
55.765 bln
+25.447 mln
0.05%
Ranking of countries by current statistics by years


Comments: