29
/
en
AIzaSyAYiBZKx7MnpbEhh9jyipgxe19OcubqV5w
April 1, 2024
202965
Mozambique
MOZ
true
2
1
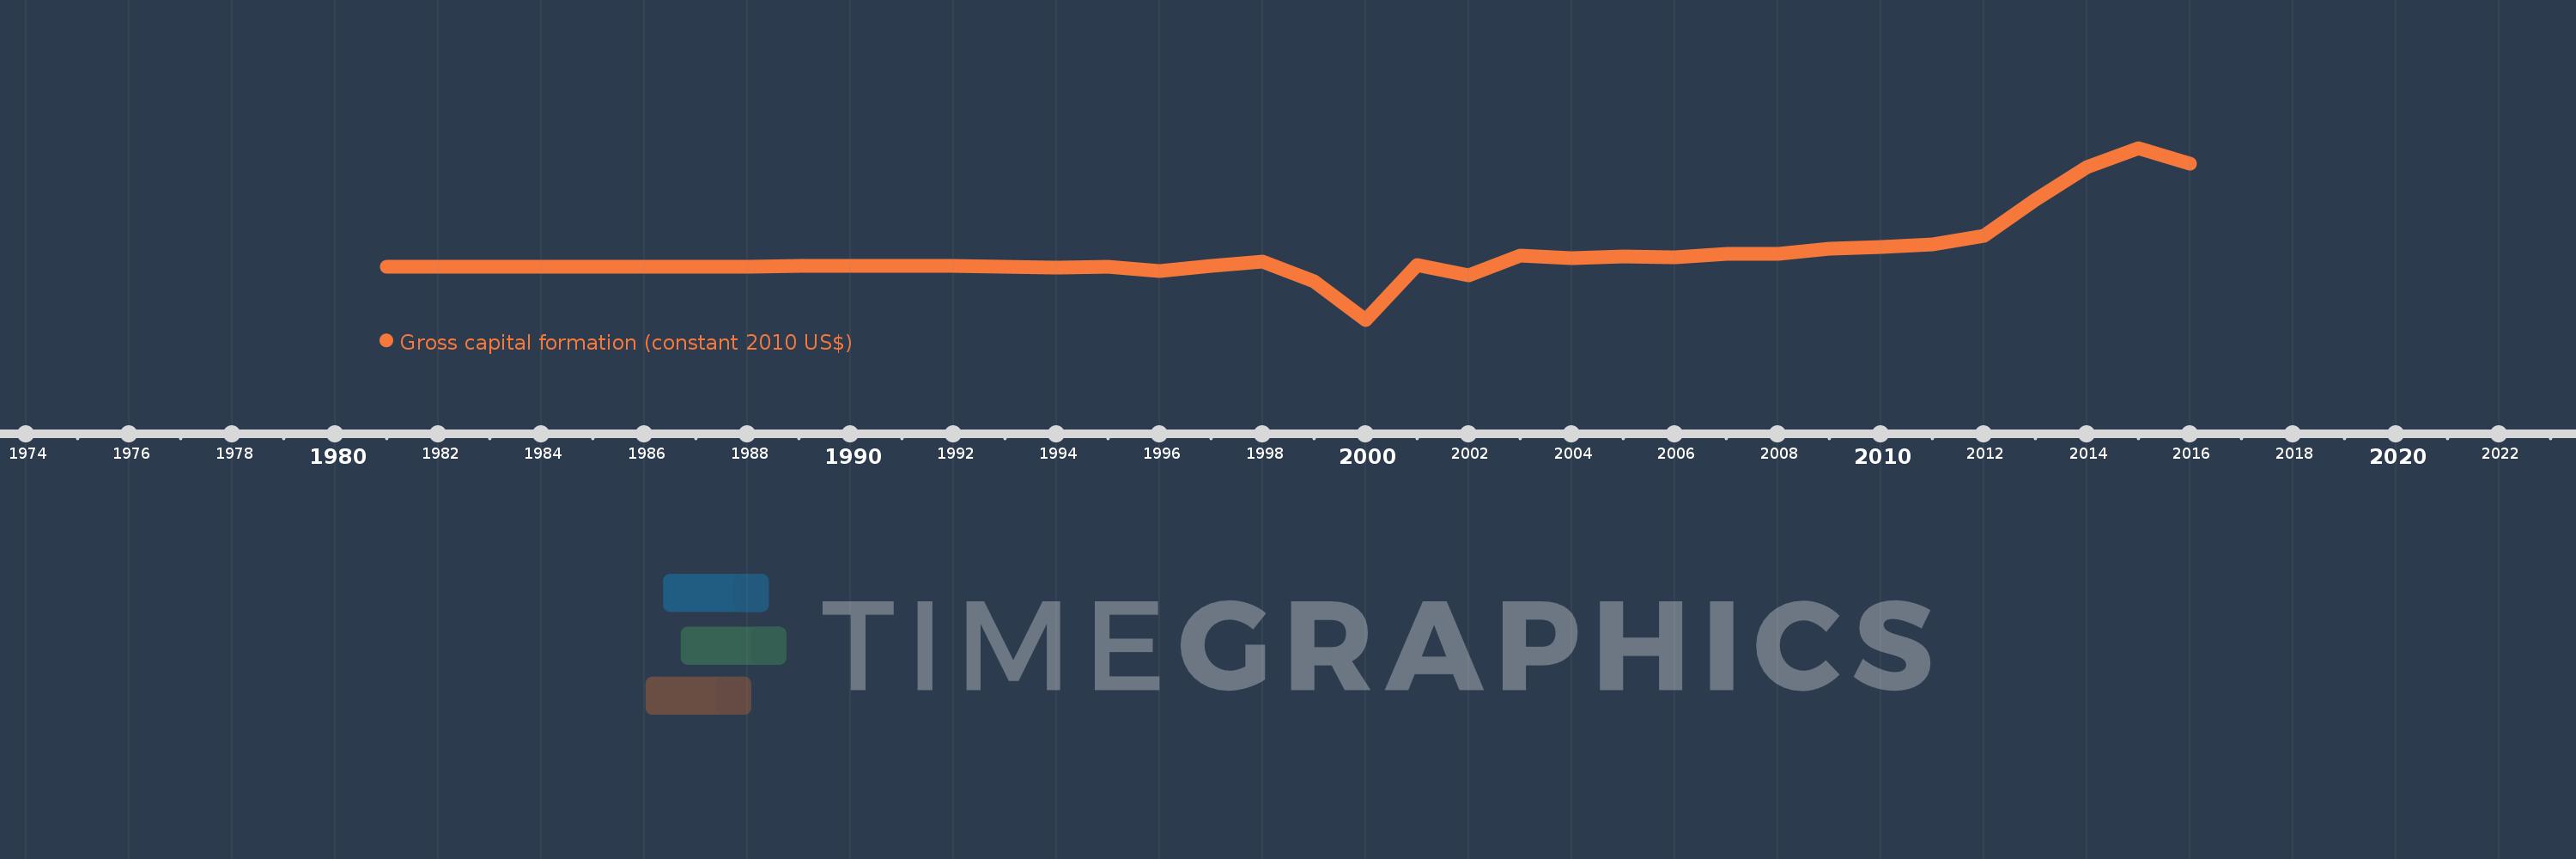
Gross capital formation (constant 2010 US$)
2016,2015,2014,2013,2012,2011,2010,2009,2008,2007,2006,2005,2004,2003,2002,2001,2000,1999,1998,1997,1996,1995,1994,1993,1992,1991,1990,1989,1988,1987,1986,1985,1984,1983,1982,1981
This statistics in other country:
AfghanistanAlbaniaAlgeriaAngolaAntigua and BarbudaArab WorldArgentinaArmeniaArubaAustraliaAustriaAzerbaijanBahamas, TheBahrainBangladeshBarbadosBelarusBelgiumBelizeBeninBermudaBhutanBoliviaBosnia and HerzegovinaBotswanaBrazilBrunei DarussalamBulgariaBurkina FasoBurundiCabo VerdeCambodiaCameroonCanadaCaribbean small statesCentral African RepublicCentral Europe and the BalticsChadChileChinaColombiaComorosCongo, Dem. Rep.Congo, Rep.Cote d'IvoireCroatiaCubaCyprusCzech RepublicDenmarkDominicaDominican RepublicEarly-demographic dividendEast Asia & PacificEast Asia & Pacific (excluding high income)East Asia & Pacific (IDA & IBRD countries)EcuadorEgypt, Arab Rep.El SalvadorEquatorial GuineaEritreaEstoniaEthiopiaEuro areaEurope & Central AsiaEurope & Central Asia (excluding high income)Europe & Central Asia (IDA & IBRD countries)European UnionFaroe IslandsFinlandFragile and conflict affected situationsFranceGabonGambia, TheGeorgiaGermanyGhanaGreeceGrenadaGuatemalaGuineaGuinea-BissauGuyanaHaitiHeavily indebted poor countries (HIPC)High incomeHondurasHong Kong SAR, ChinaHungaryIBRD onlyIcelandIDA & IBRD totalIDA blendIDA onlyIDA totalIndiaIndonesiaIran, Islamic Rep.IraqIrelandIsraelItalyJamaicaJapanJordanKazakhstanKenyaKorea, Rep.KosovoKuwaitKyrgyz RepublicLao PDRLate-demographic dividendLatin America & Caribbean Latin America & Caribbean (excluding high income)Latin America & the Caribbean (IDA & IBRD countries)LatviaLeast developed countries: UN classificationLebanonLiberiaLithuaniaLow & middle incomeLow incomeLower middle incomeLuxembourgMacao SAR, ChinaMacedonia, FYRMadagascarMalawiMalaysiaMaliMaltaMauritaniaMauritiusMexicoMiddle East & North AfricaMiddle East & North Africa (excluding high income)Middle East & North Africa (IDA & IBRD countries)Middle incomeMoldovaMongoliaMontenegroMoroccoMozambiqueNamibiaNepalNetherlandsNew ZealandNicaraguaNigerNigeriaNorth AmericaNorwayOECD membersOmanOther small statesPakistanPanamaParaguayPeruPhilippinesPolandPortugalPost-demographic dividendPre-demographic dividendPuerto RicoQatarRomaniaRussian FederationRwandaSaudi ArabiaSenegalSerbiaSeychellesSierra LeoneSingaporeSlovak RepublicSloveniaSmall statesSouth AfricaSouth AsiaSouth Asia (IDA & IBRD)South SudanSpainSri LankaSt. Kitts and NevisSt. LuciaSt. Vincent and the GrenadinesSub-Saharan Africa Sub-Saharan Africa (excluding high income)Sub-Saharan Africa (IDA & IBRD countries)SudanSurinameSwazilandSwedenSwitzerlandTajikistanTanzaniaThailandTimor-LesteTogoTongaTrinidad and TobagoTunisiaTurkeyTurkmenistanUgandaUkraineUnited Arab EmiratesUnited KingdomUnited StatesUpper middle incomeUruguayUzbekistanVanuatuVenezuela, RBVietnamWest Bank and GazaWorldYemen, Rep.ZambiaZimbabwe Timeline:
This timeline shows a graph from 1981 to 2016 of Mozambique. No data until 1980. Number of actual observations by date: 36.
Source name:
World Development Indicators
Source organization:
World Bank national accounts data, and OECD National Accounts data files.
Categories, topics:
Economy & Growth
Last updated:
apr 23, 2017
Indicators value changes by year
Minimum:
-4.181 bln
jan 1, 2000
Maximum:
9.561 bln
jan 1, 2015
At the date of observation
Value
Absolute change
Change from previous value
jan 1, 1981
74.965 mln
+74.965 mln
0.0%
jan 1, 1982
78.039 mln
+3.074 mln
4.1%
jan 1, 1983
74.75 mln
-3.289 mln
-4.21%
jan 1, 1984
61.52 mln
-13.231 mln
-17.7%
jan 1, 1985
69.517 mln
+7.998 mln
13.0%
jan 1, 1986
64.929 mln
-4.588 mln
-6.6%
jan 1, 1987
74.668 mln
+9.739 mln
15.0%
jan 1, 1988
86.093 mln
+11.424 mln
15.3%
jan 1, 1989
94.616 mln
+8.523 mln
9.9%
jan 1, 1990
100.198 mln
+5.582 mln
5.9%
jan 1, 1991
111.735 mln
+11.536 mln
11.51%
jan 1, 1992
107.894 mln
-3.84 mln
-3.44%
jan 1, 1993
33.103 mln
-74.791 mln
-69.32%
jan 1, 1994
-43.309 mln
-76.412 mln
-230.83%
jan 1, 1995
68.447 mln
+111.756 mln
-258.04%
jan 1, 1996
-313.858 mln
-382.306 mln
-558.54%
jan 1, 1997
94.294 mln
+408.152 mln
-130.04%
jan 1, 1998
458.396 mln
+364.102 mln
386.14%
jan 1, 1999
-1.099 bln
-1.557 bln
-339.66%
jan 1, 2000
-4.181 bln
-3.082 bln
280.57%
jan 1, 2001
193.805 mln
+4.375 bln
-104.64%
jan 1, 2002
-645.168 mln
-838.973 mln
-432.9%
jan 1, 2003
964.976 mln
+1.61 bln
-249.57%
jan 1, 2004
750.89 mln
-214.086 mln
-22.19%
jan 1, 2005
905.844 mln
+154.954 mln
20.64%
jan 1, 2006
796.614 mln
-109.23 mln
-12.06%
jan 1, 2007
1.12 bln
+323.838 mln
40.65%
jan 1, 2008
1.059 bln
-61.836 mln
-5.52%
jan 1, 2009
1.532 bln
+473.879 mln
44.76%
jan 1, 2010
1.644 bln
+111.718 mln
7.29%
jan 1, 2011
1.858 bln
+213.557 mln
12.99%
jan 1, 2012
2.552 bln
+694.595 mln
37.39%
jan 1, 2013
5.447 bln
+2.894 bln
113.4%
jan 1, 2014
8.052 bln
+2.605 bln
47.83%
jan 1, 2015
9.561 bln
+1.509 bln
18.74%
jan 1, 2016
8.296 bln
-1.265 bln
-13.23%
Ranking of countries by current statistics by years


Comments: