29
/
en
AIzaSyAYiBZKx7MnpbEhh9jyipgxe19OcubqV5w
April 1, 2024
118954
Denmark
DNK
true
2
1
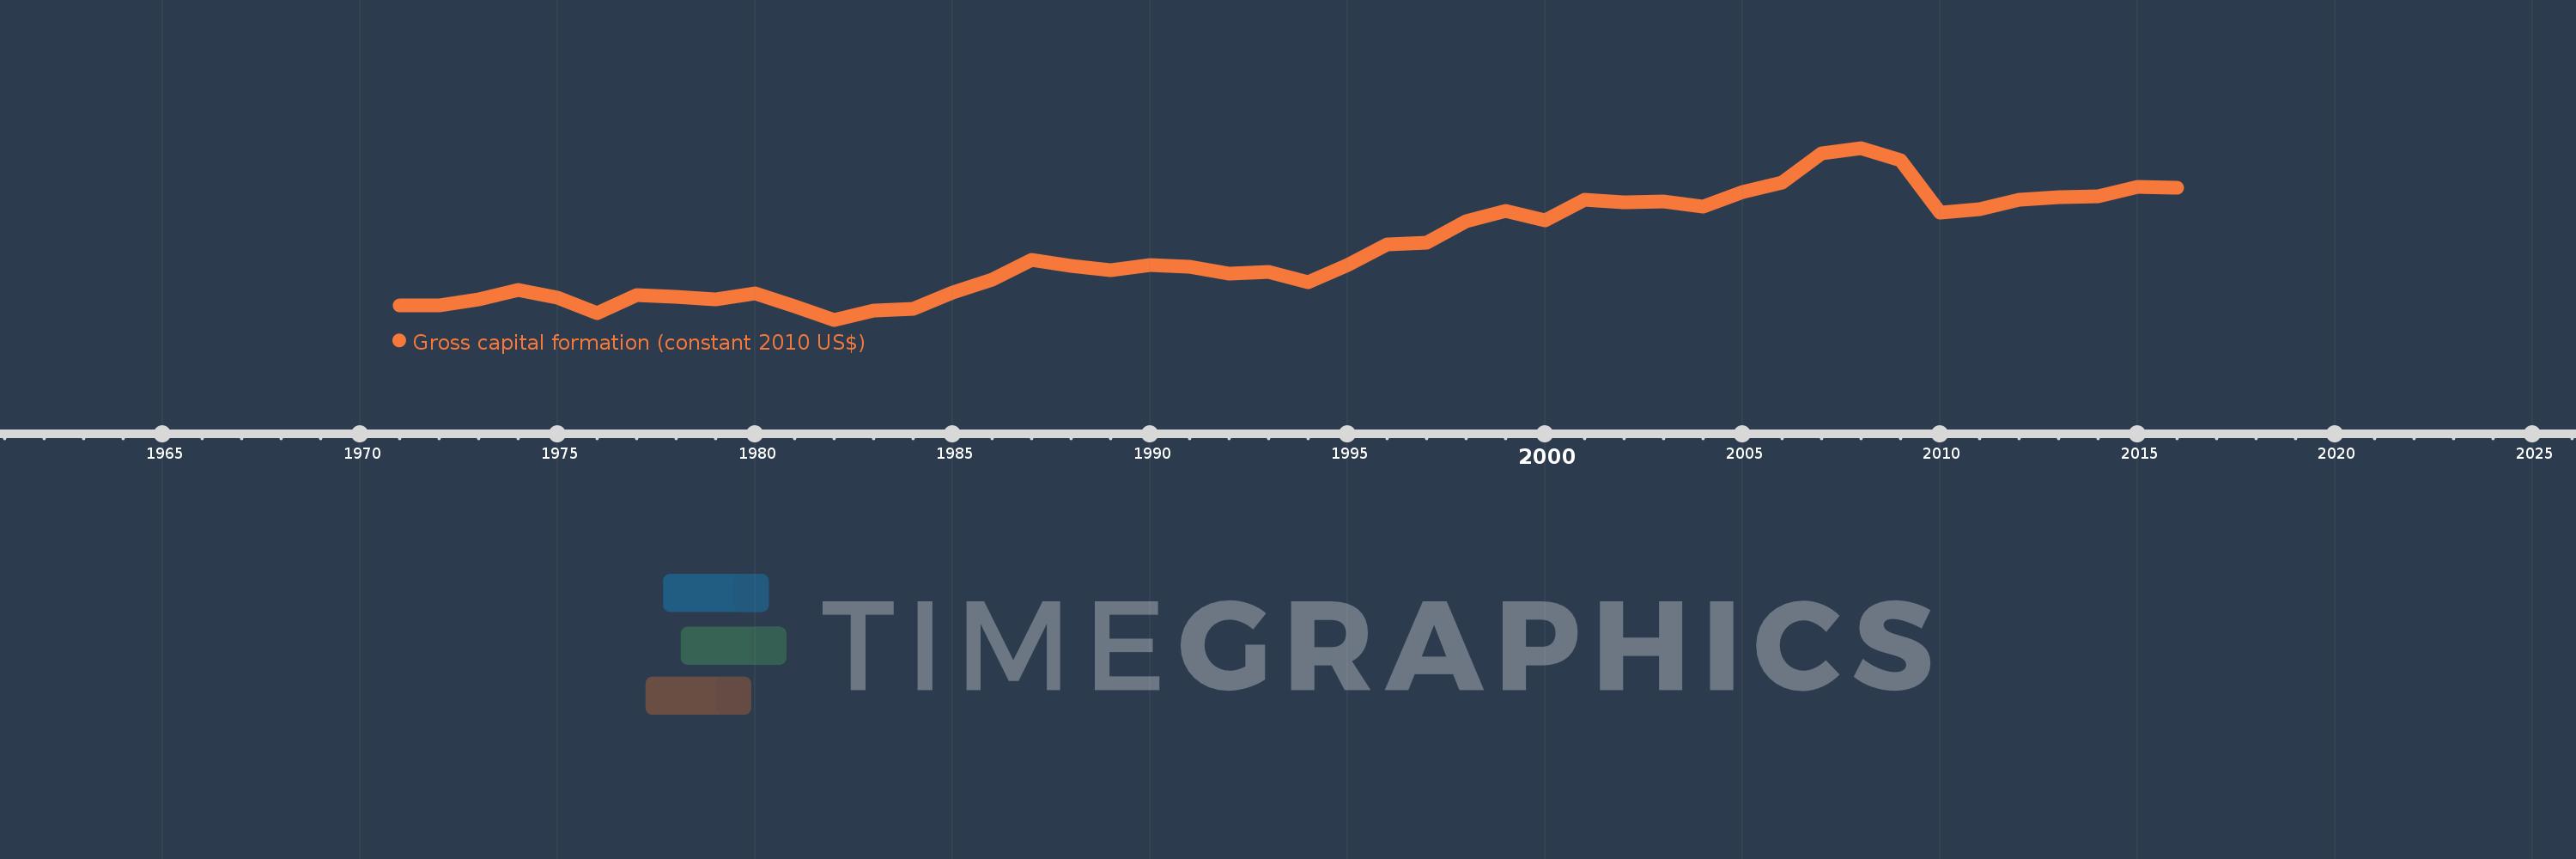
Gross capital formation (constant 2010 US$)
2016,2015,2014,2013,2012,2011,2010,2009,2008,2007,2006,2005,2004,2003,2002,2001,2000,1999,1998,1997,1996,1995,1994,1993,1992,1991,1990,1989,1988,1987,1986,1985,1984,1983,1982,1981,1980,1979,1978,1977,1976,1975,1974,1973,1972,1971
This statistics in other country:
AfghanistanAlbaniaAlgeriaAngolaAntigua and BarbudaArab WorldArgentinaArmeniaArubaAustraliaAustriaAzerbaijanBahamas, TheBahrainBangladeshBarbadosBelarusBelgiumBelizeBeninBermudaBhutanBoliviaBosnia and HerzegovinaBotswanaBrazilBrunei DarussalamBulgariaBurkina FasoBurundiCabo VerdeCambodiaCameroonCanadaCaribbean small statesCentral African RepublicCentral Europe and the BalticsChadChileChinaColombiaComorosCongo, Dem. Rep.Congo, Rep.Cote d'IvoireCroatiaCubaCyprusCzech RepublicDenmarkDominicaDominican RepublicEarly-demographic dividendEast Asia & PacificEast Asia & Pacific (excluding high income)East Asia & Pacific (IDA & IBRD countries)EcuadorEgypt, Arab Rep.El SalvadorEquatorial GuineaEritreaEstoniaEthiopiaEuro areaEurope & Central AsiaEurope & Central Asia (excluding high income)Europe & Central Asia (IDA & IBRD countries)European UnionFaroe IslandsFinlandFragile and conflict affected situationsFranceGabonGambia, TheGeorgiaGermanyGhanaGreeceGrenadaGuatemalaGuineaGuinea-BissauGuyanaHaitiHeavily indebted poor countries (HIPC)High incomeHondurasHong Kong SAR, ChinaHungaryIBRD onlyIcelandIDA & IBRD totalIDA blendIDA onlyIDA totalIndiaIndonesiaIran, Islamic Rep.IraqIrelandIsraelItalyJamaicaJapanJordanKazakhstanKenyaKorea, Rep.KosovoKuwaitKyrgyz RepublicLao PDRLate-demographic dividendLatin America & Caribbean Latin America & Caribbean (excluding high income)Latin America & the Caribbean (IDA & IBRD countries)LatviaLeast developed countries: UN classificationLebanonLiberiaLithuaniaLow & middle incomeLow incomeLower middle incomeLuxembourgMacao SAR, ChinaMacedonia, FYRMadagascarMalawiMalaysiaMaliMaltaMauritaniaMauritiusMexicoMiddle East & North AfricaMiddle East & North Africa (excluding high income)Middle East & North Africa (IDA & IBRD countries)Middle incomeMoldovaMongoliaMontenegroMoroccoMozambiqueNamibiaNepalNetherlandsNew ZealandNicaraguaNigerNigeriaNorth AmericaNorwayOECD membersOmanOther small statesPakistanPanamaParaguayPeruPhilippinesPolandPortugalPost-demographic dividendPre-demographic dividendPuerto RicoQatarRomaniaRussian FederationRwandaSaudi ArabiaSenegalSerbiaSeychellesSierra LeoneSingaporeSlovak RepublicSloveniaSmall statesSouth AfricaSouth AsiaSouth Asia (IDA & IBRD)South SudanSpainSri LankaSt. Kitts and NevisSt. LuciaSt. Vincent and the GrenadinesSub-Saharan Africa Sub-Saharan Africa (excluding high income)Sub-Saharan Africa (IDA & IBRD countries)SudanSurinameSwazilandSwedenSwitzerlandTajikistanTanzaniaThailandTimor-LesteTogoTongaTrinidad and TobagoTunisiaTurkeyTurkmenistanUgandaUkraineUnited Arab EmiratesUnited KingdomUnited StatesUpper middle incomeUruguayUzbekistanVanuatuVenezuela, RBVietnamWest Bank and GazaWorldYemen, Rep.ZambiaZimbabwe Timeline:
This timeline shows a graph from 1971 to 2016 of Denmark. No data until 1970. Number of actual observations by date: 46.
Source name:
World Development Indicators
Source organization:
World Bank national accounts data, and OECD National Accounts data files.
Categories, topics:
Economy & Growth
Last updated:
apr 23, 2017
Indicators value changes by year
Minimum:
23.759 bln
jan 1, 1982
Maximum:
78.418 bln
jan 1, 2008
At the date of observation
Value
Absolute change
Change from previous value
jan 1, 1971
28.29 bln
+28.29 bln
0.0%
jan 1, 1972
28.22 bln
-69.482 mln
-0.25%
jan 1, 1973
30.249 bln
+2.029 bln
7.19%
jan 1, 1974
33.375 bln
+3.126 bln
10.33%
jan 1, 1975
30.682 bln
-2.693 bln
-8.07%
jan 1, 1976
25.877 bln
-4.805 bln
-15.66%
jan 1, 1977
31.638 bln
+5.761 bln
22.26%
jan 1, 1978
30.984 bln
-653.541 mln
-2.07%
jan 1, 1979
30.331 bln
-653.774 mln
-2.11%
jan 1, 1980
32.02 bln
+1.69 bln
5.57%
jan 1, 1981
28.017 bln
-4.004 bln
-12.5%
jan 1, 1982
23.759 bln
-4.258 bln
-15.2%
jan 1, 1983
26.606 bln
+2.847 bln
11.98%
jan 1, 1984
27.316 bln
+710.345 mln
2.67%
jan 1, 1985
32.466 bln
+5.149 bln
18.85%
jan 1, 1986
36.406 bln
+3.94 bln
12.14%
jan 1, 1987
42.891 bln
+6.485 bln
17.81%
jan 1, 1988
41.02 bln
-1.871 bln
-4.36%
jan 1, 1989
39.603 bln
-1.417 bln
-3.46%
jan 1, 1990
41.136 bln
+1.533 bln
3.87%
jan 1, 1991
40.618 bln
-518.066 mln
-1.26%
jan 1, 1992
38.553 bln
-2.065 bln
-5.08%
jan 1, 1993
39.087 bln
+533.817 mln
1.38%
jan 1, 1994
35.581 bln
-3.506 bln
-8.97%
jan 1, 1995
41.124 bln
+5.543 bln
15.58%
jan 1, 1996
47.644 bln
+6.52 bln
15.85%
jan 1, 1997
48.146 bln
+502.303 mln
1.05%
jan 1, 1998
55.083 bln
+6.937 bln
14.41%
jan 1, 1999
58.321 bln
+3.238 bln
5.88%
jan 1, 2000
55.476 bln
-2.845 bln
-4.88%
jan 1, 2001
61.991 bln
+6.515 bln
11.74%
jan 1, 2002
61.078 bln
-913.391 mln
-1.47%
jan 1, 2003
61.271 bln
+193.631 mln
0.32%
jan 1, 2004
59.885 bln
-1.387 bln
-2.26%
jan 1, 2005
64.324 bln
+4.439 bln
7.41%
jan 1, 2006
67.345 bln
+3.021 bln
4.7%
jan 1, 2007
76.681 bln
+9.336 bln
13.86%
jan 1, 2008
78.418 bln
+1.736 bln
2.26%
jan 1, 2009
74.381 bln
-4.037 bln
-5.15%
jan 1, 2010
57.726 bln
-16.655 bln
-22.39%
jan 1, 2011
58.901 bln
+1.175 bln
2.04%
jan 1, 2012
61.879 bln
+2.978 bln
5.06%
jan 1, 2013
62.86 bln
+981.135 mln
1.59%
jan 1, 2014
63.09 bln
+229.548 mln
0.37%
jan 1, 2015
66.013 bln
+2.923 bln
4.63%
jan 1, 2016
65.705 bln
-308.138 mln
-0.47%
Ranking of countries by current statistics by years


Comments: