29
/
en
AIzaSyAYiBZKx7MnpbEhh9jyipgxe19OcubqV5w
April 1, 2024
193066
Mauritania
MRT
true
2
1
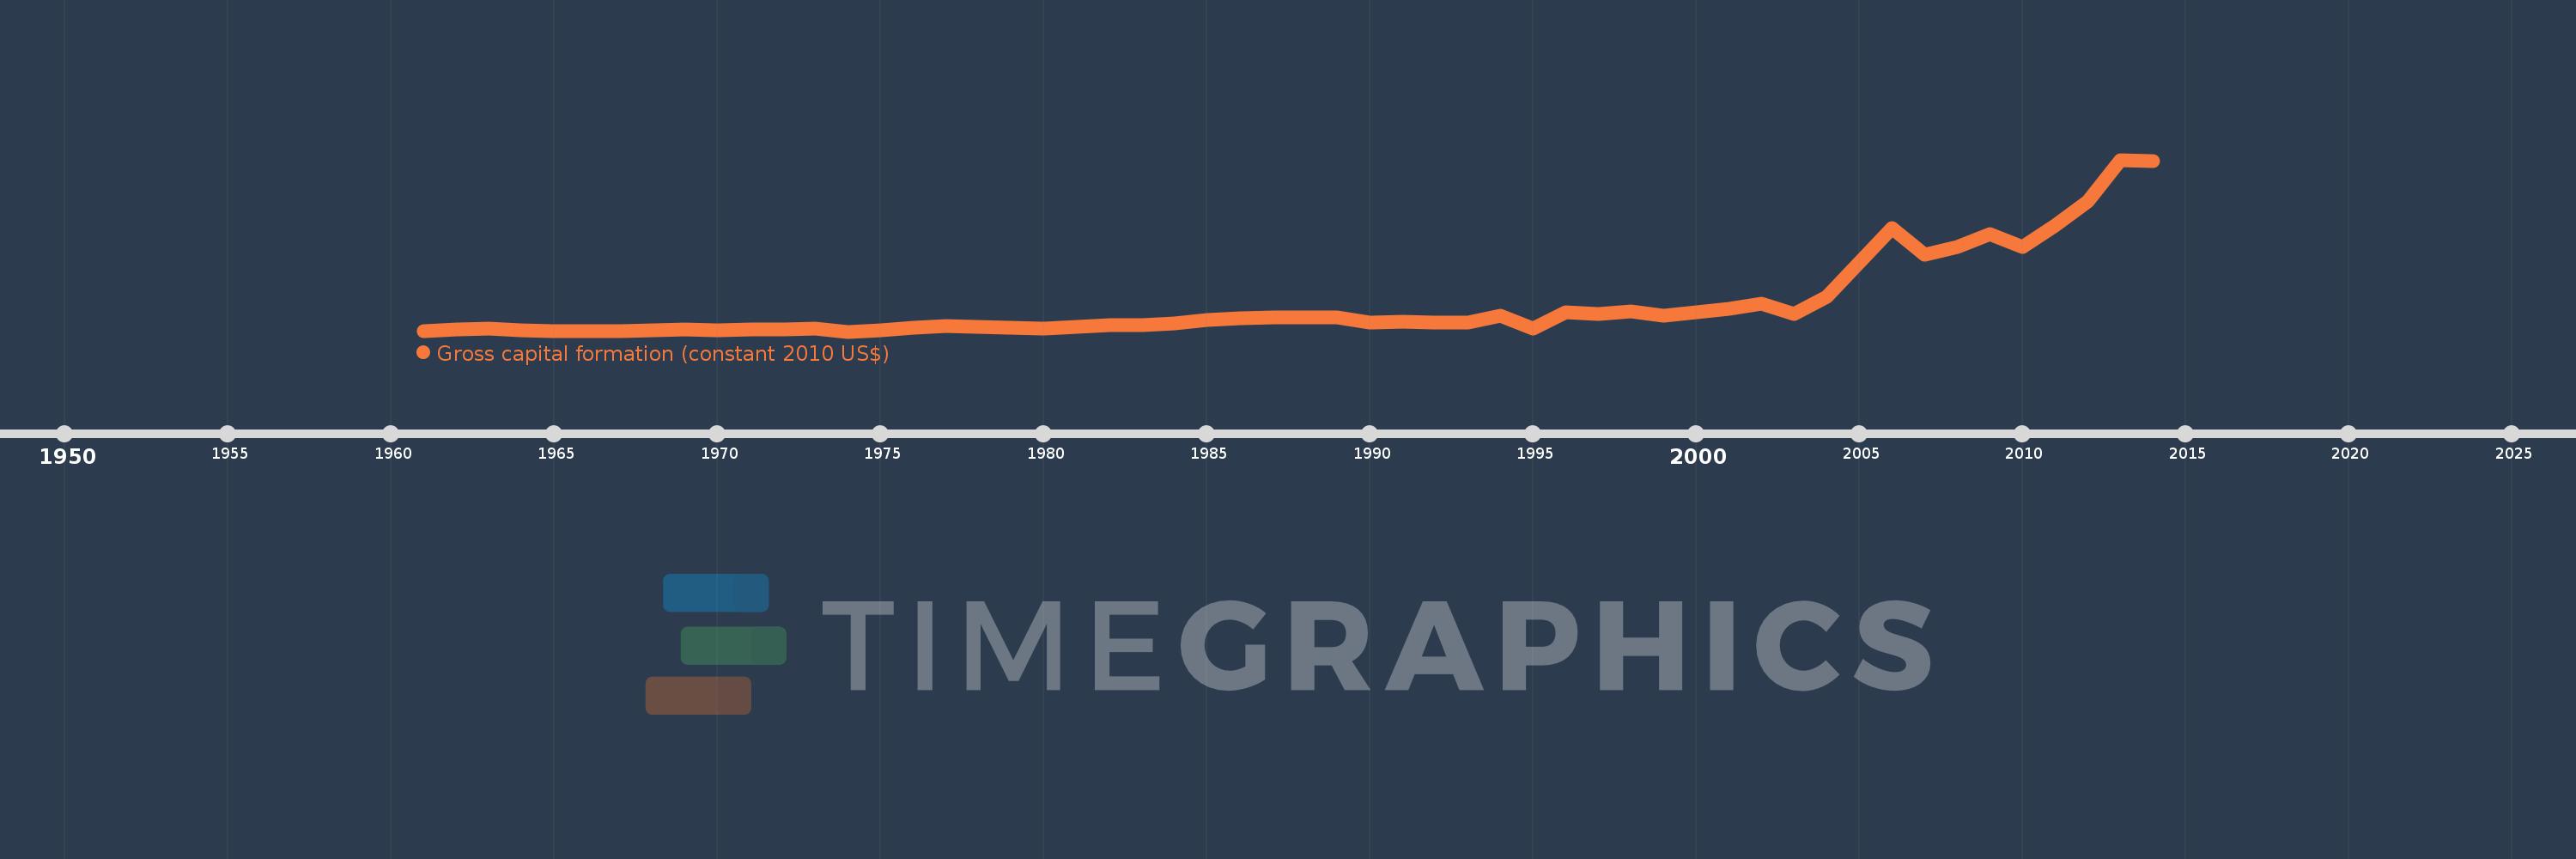
Gross capital formation (constant 2010 US$)
2014,2013,2012,2011,2010,2009,2008,2007,2006,2005,2004,2003,2002,2001,2000,1999,1998,1997,1996,1995,1994,1993,1992,1991,1990,1989,1988,1987,1986,1985,1984,1983,1982,1981,1980,1979,1978,1977,1976,1975,1974,1973,1972,1971,1970,1969,1968,1967,1966,1965,1964,1963,1962,1961
This statistics in other country:
AfghanistanAlbaniaAlgeriaAngolaAntigua and BarbudaArab WorldArgentinaArmeniaArubaAustraliaAustriaAzerbaijanBahamas, TheBahrainBangladeshBarbadosBelarusBelgiumBelizeBeninBermudaBhutanBoliviaBosnia and HerzegovinaBotswanaBrazilBrunei DarussalamBulgariaBurkina FasoBurundiCabo VerdeCambodiaCameroonCanadaCaribbean small statesCentral African RepublicCentral Europe and the BalticsChadChileChinaColombiaComorosCongo, Dem. Rep.Congo, Rep.Cote d'IvoireCroatiaCubaCyprusCzech RepublicDenmarkDominicaDominican RepublicEarly-demographic dividendEast Asia & PacificEast Asia & Pacific (excluding high income)East Asia & Pacific (IDA & IBRD countries)EcuadorEgypt, Arab Rep.El SalvadorEquatorial GuineaEritreaEstoniaEthiopiaEuro areaEurope & Central AsiaEurope & Central Asia (excluding high income)Europe & Central Asia (IDA & IBRD countries)European UnionFaroe IslandsFinlandFragile and conflict affected situationsFranceGabonGambia, TheGeorgiaGermanyGhanaGreeceGrenadaGuatemalaGuineaGuinea-BissauGuyanaHaitiHeavily indebted poor countries (HIPC)High incomeHondurasHong Kong SAR, ChinaHungaryIBRD onlyIcelandIDA & IBRD totalIDA blendIDA onlyIDA totalIndiaIndonesiaIran, Islamic Rep.IraqIrelandIsraelItalyJamaicaJapanJordanKazakhstanKenyaKorea, Rep.KosovoKuwaitKyrgyz RepublicLao PDRLate-demographic dividendLatin America & Caribbean Latin America & Caribbean (excluding high income)Latin America & the Caribbean (IDA & IBRD countries)LatviaLeast developed countries: UN classificationLebanonLiberiaLithuaniaLow & middle incomeLow incomeLower middle incomeLuxembourgMacao SAR, ChinaMacedonia, FYRMadagascarMalawiMalaysiaMaliMaltaMauritaniaMauritiusMexicoMiddle East & North AfricaMiddle East & North Africa (excluding high income)Middle East & North Africa (IDA & IBRD countries)Middle incomeMoldovaMongoliaMontenegroMoroccoMozambiqueNamibiaNepalNetherlandsNew ZealandNicaraguaNigerNigeriaNorth AmericaNorwayOECD membersOmanOther small statesPakistanPanamaParaguayPeruPhilippinesPolandPortugalPost-demographic dividendPre-demographic dividendPuerto RicoQatarRomaniaRussian FederationRwandaSaudi ArabiaSenegalSerbiaSeychellesSierra LeoneSingaporeSlovak RepublicSloveniaSmall statesSouth AfricaSouth AsiaSouth Asia (IDA & IBRD)South SudanSpainSri LankaSt. Kitts and NevisSt. LuciaSt. Vincent and the GrenadinesSub-Saharan Africa Sub-Saharan Africa (excluding high income)Sub-Saharan Africa (IDA & IBRD countries)SudanSurinameSwazilandSwedenSwitzerlandTajikistanTanzaniaThailandTimor-LesteTogoTongaTrinidad and TobagoTunisiaTurkeyTurkmenistanUgandaUkraineUnited Arab EmiratesUnited KingdomUnited StatesUpper middle incomeUruguayUzbekistanVanuatuVenezuela, RBVietnamWest Bank and GazaWorldYemen, Rep.ZambiaZimbabwe Timeline:
This timeline shows a graph from 1961 to 2014 of Mauritania. No data until 1960. Number of actual observations by date: 54.
Source name:
World Development Indicators
Source organization:
World Bank national accounts data, and OECD National Accounts data files.
Categories, topics:
Economy & Growth
Last updated:
apr 23, 2017
Indicators value changes by year
Minimum:
18.857 mln
jan 1, 1974
Maximum:
2.731 bln
jan 1, 2013
At the date of observation
Value
Absolute change
Change from previous value
jan 1, 1961
31.287 mln
+31.287 mln
0.0%
jan 1, 1962
56.8 mln
+25.513 mln
81.55%
jan 1, 1963
70.581 mln
+13.781 mln
24.26%
jan 1, 1964
43.205 mln
-27.376 mln
-38.79%
jan 1, 1965
25.141 mln
-18.064 mln
-41.81%
jan 1, 1966
24.303 mln
-838.033K
-3.33%
jan 1, 1967
24.021 mln
-281.584K
-1.16%
jan 1, 1968
38.847 mln
+14.825 mln
61.72%
jan 1, 1969
54.928 mln
+16.081 mln
41.4%
jan 1, 1970
45.384 mln
-9.544 mln
-17.37%
jan 1, 1971
49.849 mln
+4.465 mln
9.84%
jan 1, 1972
52.658 mln
+2.809 mln
5.64%
jan 1, 1973
69.555 mln
+16.897 mln
32.09%
jan 1, 1974
18.857 mln
-50.698 mln
-72.89%
jan 1, 1975
39.397 mln
+20.541 mln
108.93%
jan 1, 1976
80.107 mln
+40.71 mln
103.33%
jan 1, 1977
106.909 mln
+26.801 mln
33.46%
jan 1, 1978
96.744 mln
-10.165 mln
-9.51%
jan 1, 1979
76.289 mln
-20.455 mln
-21.14%
jan 1, 1980
65.833 mln
-10.456 mln
-13.71%
jan 1, 1981
96.608 mln
+30.775 mln
46.75%
jan 1, 1982
115.565 mln
+18.957 mln
19.62%
jan 1, 1983
126.988 mln
+11.423 mln
9.88%
jan 1, 1984
145.973 mln
+18.985 mln
14.95%
jan 1, 1985
198.523 mln
+52.55 mln
36.0%
jan 1, 1986
235.637 mln
+37.113 mln
18.69%
jan 1, 1987
248.278 mln
+12.641 mln
5.36%
jan 1, 1988
243.616 mln
-4.661 mln
-1.88%
jan 1, 1989
236.173 mln
-7.443 mln
-3.06%
jan 1, 1990
161.883 mln
-74.29 mln
-31.46%
jan 1, 1991
170.993 mln
+9.11 mln
5.63%
jan 1, 1992
166.227 mln
-4.767 mln
-2.79%
jan 1, 1993
161.593 mln
-4.634 mln
-2.79%
jan 1, 1994
263.816 mln
+102.223 mln
63.26%
jan 1, 1995
62.507 mln
-201.309 mln
-76.31%
jan 1, 1996
330.699 mln
+268.191 mln
429.06%
jan 1, 1997
298.656 mln
-32.043 mln
-9.69%
jan 1, 1998
330.896 mln
+32.24 mln
10.8%
jan 1, 1999
264.418 mln
-66.478 mln
-20.09%
jan 1, 2000
325.363 mln
+60.944 mln
23.05%
jan 1, 2001
382.552 mln
+57.189 mln
17.58%
jan 1, 2002
456.128 mln
+73.576 mln
19.23%
jan 1, 2003
291.246 mln
-164.881 mln
-36.15%
jan 1, 2004
571.012 mln
+279.765 mln
96.06%
jan 1, 2005
1.105 bln
+533.85 mln
93.49%
jan 1, 2006
1.65 bln
+544.818 mln
49.31%
jan 1, 2007
1.228 bln
-421.209 mln
-25.53%
jan 1, 2008
1.356 bln
+127.756 mln
10.4%
jan 1, 2009
1.553 bln
+197.066 mln
14.53%
jan 1, 2010
1.358 bln
-194.974 mln
-12.55%
jan 1, 2011
1.7 bln
+341.78 mln
25.16%
jan 1, 2012
2.077 bln
+377.336 mln
22.19%
jan 1, 2013
2.731 bln
+653.457 mln
31.45%
jan 1, 2014
2.709 bln
-21.425 mln
-0.78%
Ranking of countries by current statistics by years


Comments: