29
/
en
AIzaSyAYiBZKx7MnpbEhh9jyipgxe19OcubqV5w
April 1, 2024
194271
Mauritius
MUS
true
2
1
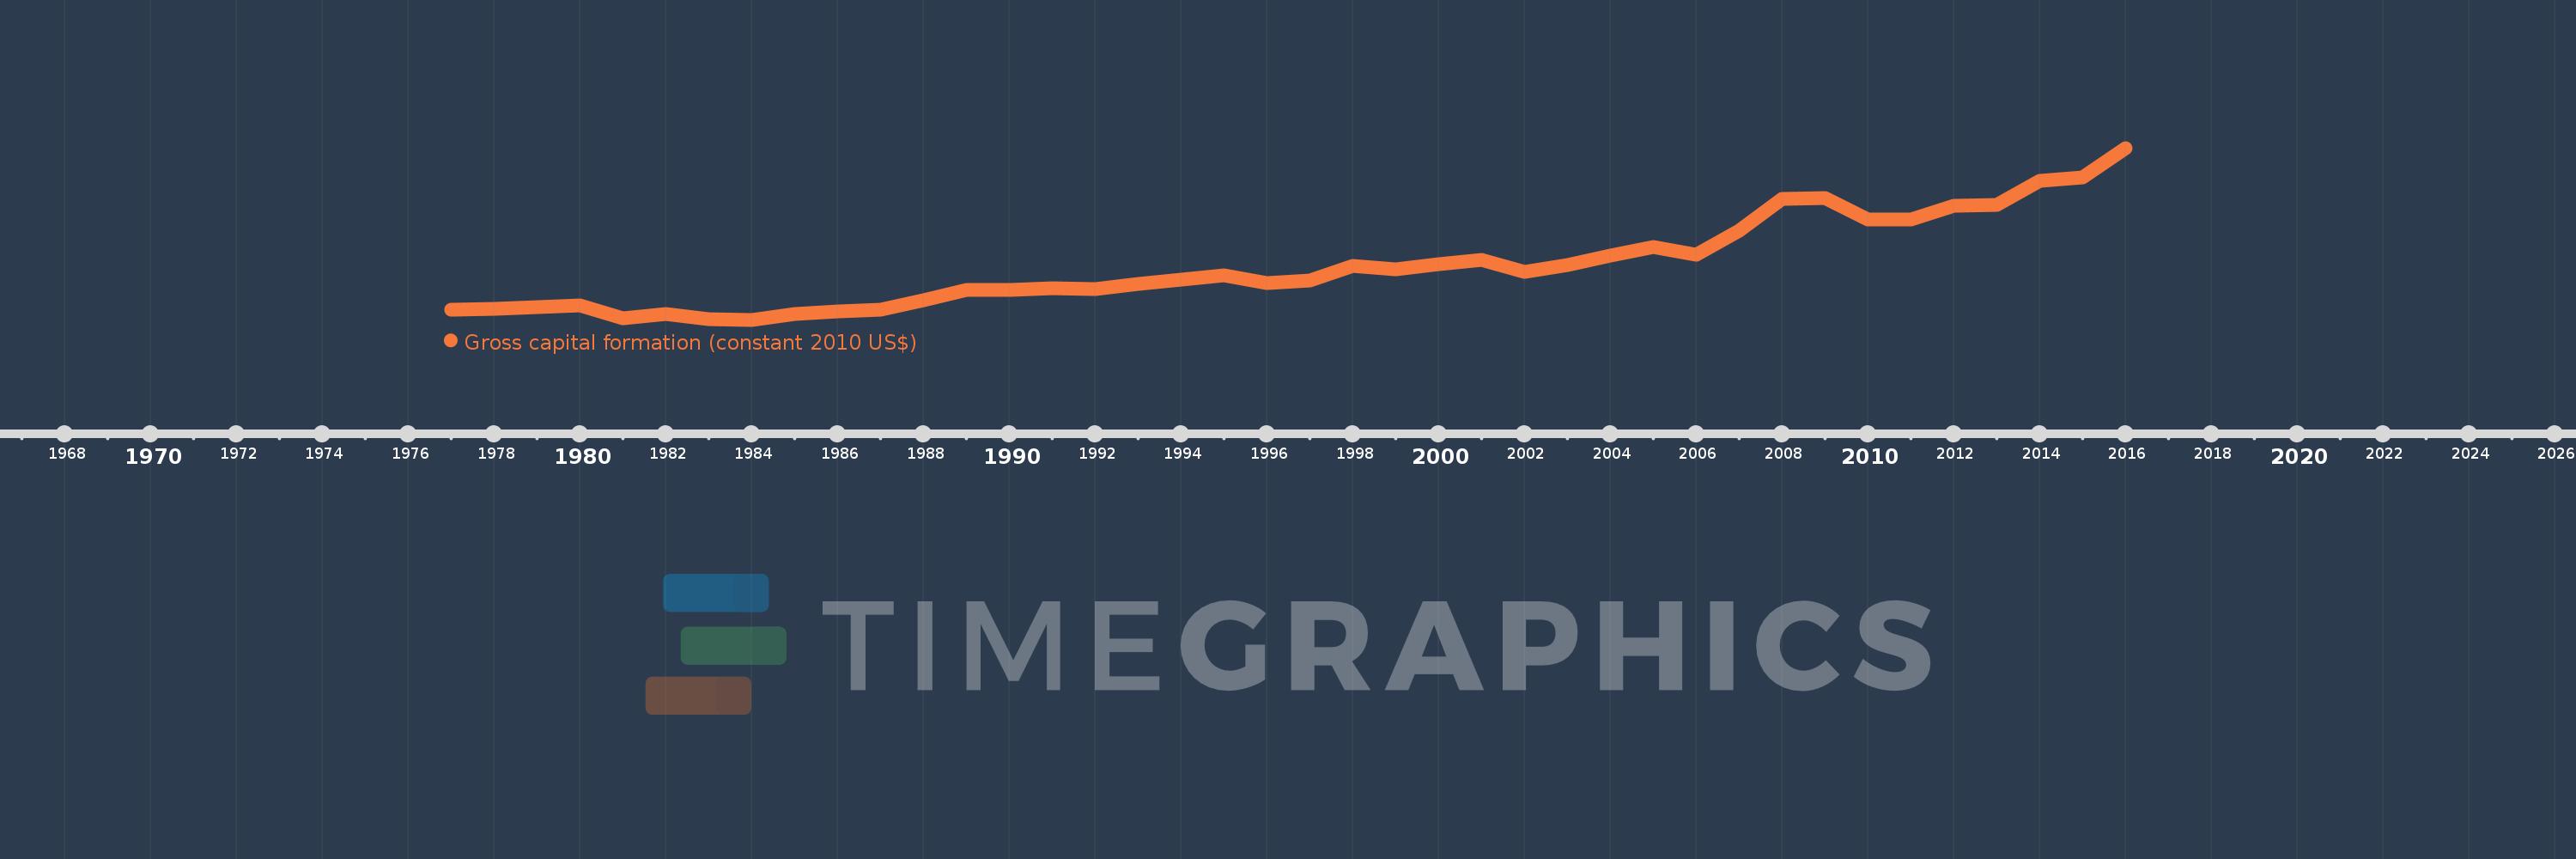
Gross capital formation (constant 2010 US$)
2016,2015,2014,2013,2012,2011,2010,2009,2008,2007,2006,2005,2004,2003,2002,2001,2000,1999,1998,1997,1996,1995,1994,1993,1992,1991,1990,1989,1988,1987,1986,1985,1984,1983,1982,1981,1980,1979,1978,1977
This statistics in other country:
AfghanistanAlbaniaAlgeriaAngolaAntigua and BarbudaArab WorldArgentinaArmeniaArubaAustraliaAustriaAzerbaijanBahamas, TheBahrainBangladeshBarbadosBelarusBelgiumBelizeBeninBermudaBhutanBoliviaBosnia and HerzegovinaBotswanaBrazilBrunei DarussalamBulgariaBurkina FasoBurundiCabo VerdeCambodiaCameroonCanadaCaribbean small statesCentral African RepublicCentral Europe and the BalticsChadChileChinaColombiaComorosCongo, Dem. Rep.Congo, Rep.Cote d'IvoireCroatiaCubaCyprusCzech RepublicDenmarkDominicaDominican RepublicEarly-demographic dividendEast Asia & PacificEast Asia & Pacific (excluding high income)East Asia & Pacific (IDA & IBRD countries)EcuadorEgypt, Arab Rep.El SalvadorEquatorial GuineaEritreaEstoniaEthiopiaEuro areaEurope & Central AsiaEurope & Central Asia (excluding high income)Europe & Central Asia (IDA & IBRD countries)European UnionFaroe IslandsFinlandFragile and conflict affected situationsFranceGabonGambia, TheGeorgiaGermanyGhanaGreeceGrenadaGuatemalaGuineaGuinea-BissauGuyanaHaitiHeavily indebted poor countries (HIPC)High incomeHondurasHong Kong SAR, ChinaHungaryIBRD onlyIcelandIDA & IBRD totalIDA blendIDA onlyIDA totalIndiaIndonesiaIran, Islamic Rep.IraqIrelandIsraelItalyJamaicaJapanJordanKazakhstanKenyaKorea, Rep.KosovoKuwaitKyrgyz RepublicLao PDRLate-demographic dividendLatin America & Caribbean Latin America & Caribbean (excluding high income)Latin America & the Caribbean (IDA & IBRD countries)LatviaLeast developed countries: UN classificationLebanonLiberiaLithuaniaLow & middle incomeLow incomeLower middle incomeLuxembourgMacao SAR, ChinaMacedonia, FYRMadagascarMalawiMalaysiaMaliMaltaMauritaniaMauritiusMexicoMiddle East & North AfricaMiddle East & North Africa (excluding high income)Middle East & North Africa (IDA & IBRD countries)Middle incomeMoldovaMongoliaMontenegroMoroccoMozambiqueNamibiaNepalNetherlandsNew ZealandNicaraguaNigerNigeriaNorth AmericaNorwayOECD membersOmanOther small statesPakistanPanamaParaguayPeruPhilippinesPolandPortugalPost-demographic dividendPre-demographic dividendPuerto RicoQatarRomaniaRussian FederationRwandaSaudi ArabiaSenegalSerbiaSeychellesSierra LeoneSingaporeSlovak RepublicSloveniaSmall statesSouth AfricaSouth AsiaSouth Asia (IDA & IBRD)South SudanSpainSri LankaSt. Kitts and NevisSt. LuciaSt. Vincent and the GrenadinesSub-Saharan Africa Sub-Saharan Africa (excluding high income)Sub-Saharan Africa (IDA & IBRD countries)SudanSurinameSwazilandSwedenSwitzerlandTajikistanTanzaniaThailandTimor-LesteTogoTongaTrinidad and TobagoTunisiaTurkeyTurkmenistanUgandaUkraineUnited Arab EmiratesUnited KingdomUnited StatesUpper middle incomeUruguayUzbekistanVanuatuVenezuela, RBVietnamWest Bank and GazaWorldYemen, Rep.ZambiaZimbabwe Timeline:
This timeline shows a graph from 1977 to 2016 of Mauritius. No data until 1976. Number of actual observations by date: 40.
Source name:
World Development Indicators
Source organization:
World Bank national accounts data, and OECD National Accounts data files.
Categories, topics:
Economy & Growth
Last updated:
apr 23, 2017
Indicators value changes by year
Minimum:
380.284 mln
jan 1, 1984
Maximum:
4.375 bln
jan 1, 2016
At the date of observation
Value
Absolute change
Change from previous value
jan 1, 1977
616.335 mln
+616.335 mln
0.0%
jan 1, 1978
629.042 mln
+12.707 mln
2.06%
jan 1, 1979
679.316 mln
+50.274 mln
7.99%
jan 1, 1980
710.899 mln
+31.584 mln
4.65%
jan 1, 1981
423.54 mln
-287.36 mln
-40.42%
jan 1, 1982
509.116 mln
+85.576 mln
20.2%
jan 1, 1983
385.697 mln
-123.419 mln
-24.24%
jan 1, 1984
380.284 mln
-5.413 mln
-1.4%
jan 1, 1985
507.961 mln
+127.678 mln
33.57%
jan 1, 1986
576.355 mln
+68.393 mln
13.46%
jan 1, 1987
610.322 mln
+33.968 mln
5.89%
jan 1, 1988
826.857 mln
+216.535 mln
35.48%
jan 1, 1989
1.065 bln
+238.121 mln
28.8%
jan 1, 1990
1.083 bln
+17.765 mln
1.67%
jan 1, 1991
1.105 bln
+22.723 mln
2.1%
jan 1, 1992
1.091 bln
-14.868 mln
-1.34%
jan 1, 1993
1.205 bln
+114.822 mln
10.53%
jan 1, 1994
1.31 bln
+104.806 mln
8.69%
jan 1, 1995
1.414 bln
+103.549 mln
7.9%
jan 1, 1996
1.231 bln
-182.632 mln
-12.92%
jan 1, 1997
1.287 bln
+56.247 mln
4.57%
jan 1, 1998
1.638 bln
+350.205 mln
27.2%
jan 1, 1999
1.557 bln
-80.708 mln
-4.93%
jan 1, 2000
1.669 bln
+112.608 mln
7.23%
jan 1, 2001
1.776 bln
+106.195 mln
6.36%
jan 1, 2002
1.489 bln
-287.169 mln
-16.17%
jan 1, 2003
1.655 bln
+166.842 mln
11.21%
jan 1, 2004
1.868 bln
+212.627 mln
12.84%
jan 1, 2005
2.073 bln
+205.5 mln
11.0%
jan 1, 2006
1.895 bln
-178.881 mln
-8.63%
jan 1, 2007
2.443 bln
+548.319 mln
28.94%
jan 1, 2008
3.193 bln
+750.543 mln
30.72%
jan 1, 2009
3.219 bln
+25.046 mln
0.78%
jan 1, 2010
2.704 bln
-514.88 mln
-16.0%
jan 1, 2011
2.712 bln
+7.897 mln
0.29%
jan 1, 2012
3.027 bln
+315.362 mln
11.63%
jan 1, 2013
3.046 bln
+19.382 mln
0.64%
jan 1, 2014
3.614 bln
+567.339 mln
18.62%
jan 1, 2015
3.681 bln
+67.447 mln
1.87%
jan 1, 2016
4.375 bln
+693.621 mln
18.84%
Ranking of countries by current statistics by years


Comments: