29
/
en
AIzaSyAYiBZKx7MnpbEhh9jyipgxe19OcubqV5w
April 1, 2024
99963
Cameroon
CMR
true
2
1
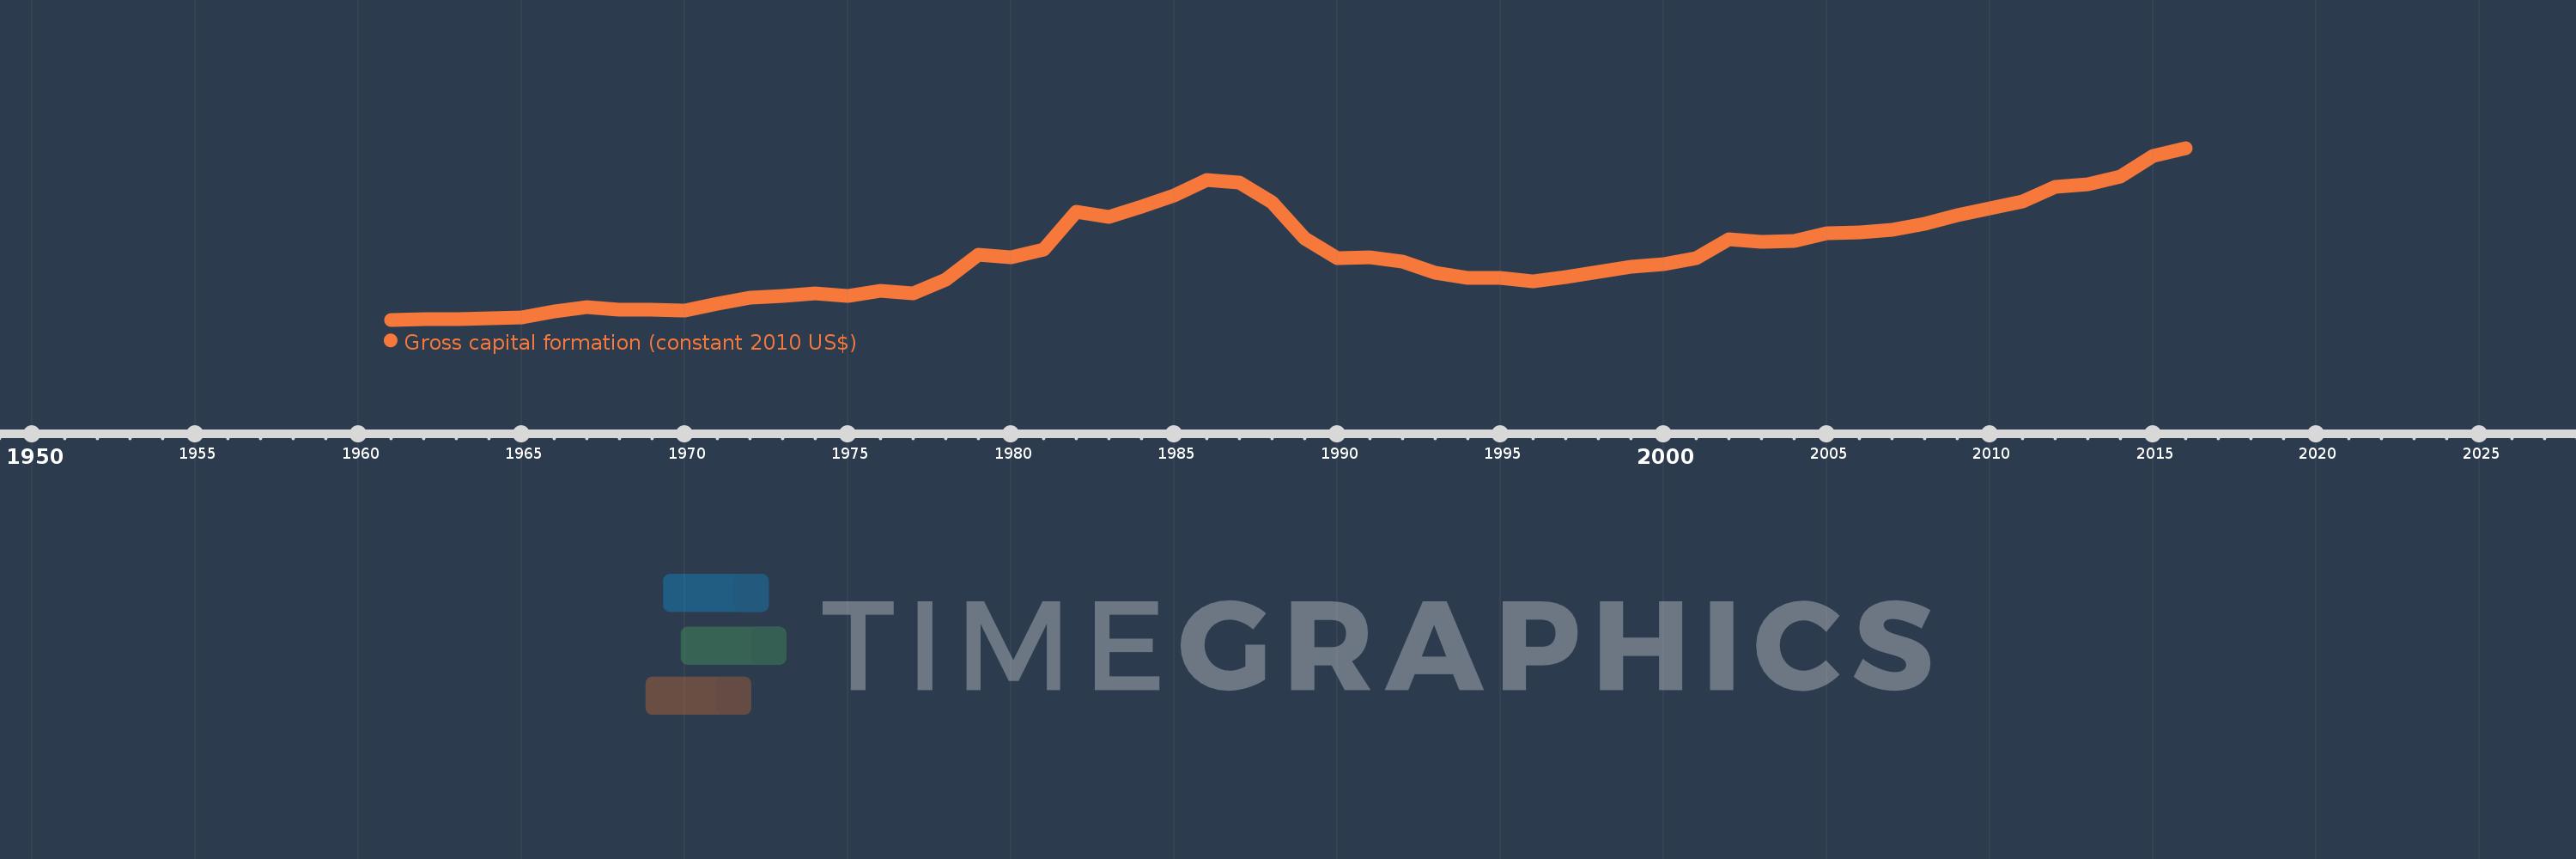
Gross capital formation (constant 2010 US$)
2016,2015,2014,2013,2012,2011,2010,2009,2008,2007,2006,2005,2004,2003,2002,2001,2000,1999,1998,1997,1996,1995,1994,1993,1992,1991,1990,1989,1988,1987,1986,1985,1984,1983,1982,1981,1980,1979,1978,1977,1976,1975,1974,1973,1972,1971,1970,1969,1968,1967,1966,1965,1964,1963,1962,1961
This statistics in other country:
AfghanistanAlbaniaAlgeriaAngolaAntigua and BarbudaArab WorldArgentinaArmeniaArubaAustraliaAustriaAzerbaijanBahamas, TheBahrainBangladeshBarbadosBelarusBelgiumBelizeBeninBermudaBhutanBoliviaBosnia and HerzegovinaBotswanaBrazilBrunei DarussalamBulgariaBurkina FasoBurundiCabo VerdeCambodiaCameroonCanadaCaribbean small statesCentral African RepublicCentral Europe and the BalticsChadChileChinaColombiaComorosCongo, Dem. Rep.Congo, Rep.Cote d'IvoireCroatiaCubaCyprusCzech RepublicDenmarkDominicaDominican RepublicEarly-demographic dividendEast Asia & PacificEast Asia & Pacific (excluding high income)East Asia & Pacific (IDA & IBRD countries)EcuadorEgypt, Arab Rep.El SalvadorEquatorial GuineaEritreaEstoniaEthiopiaEuro areaEurope & Central AsiaEurope & Central Asia (excluding high income)Europe & Central Asia (IDA & IBRD countries)European UnionFaroe IslandsFinlandFragile and conflict affected situationsFranceGabonGambia, TheGeorgiaGermanyGhanaGreeceGrenadaGuatemalaGuineaGuinea-BissauGuyanaHaitiHeavily indebted poor countries (HIPC)High incomeHondurasHong Kong SAR, ChinaHungaryIBRD onlyIcelandIDA & IBRD totalIDA blendIDA onlyIDA totalIndiaIndonesiaIran, Islamic Rep.IraqIrelandIsraelItalyJamaicaJapanJordanKazakhstanKenyaKorea, Rep.KosovoKuwaitKyrgyz RepublicLao PDRLate-demographic dividendLatin America & Caribbean Latin America & Caribbean (excluding high income)Latin America & the Caribbean (IDA & IBRD countries)LatviaLeast developed countries: UN classificationLebanonLiberiaLithuaniaLow & middle incomeLow incomeLower middle incomeLuxembourgMacao SAR, ChinaMacedonia, FYRMadagascarMalawiMalaysiaMaliMaltaMauritaniaMauritiusMexicoMiddle East & North AfricaMiddle East & North Africa (excluding high income)Middle East & North Africa (IDA & IBRD countries)Middle incomeMoldovaMongoliaMontenegroMoroccoMozambiqueNamibiaNepalNetherlandsNew ZealandNicaraguaNigerNigeriaNorth AmericaNorwayOECD membersOmanOther small statesPakistanPanamaParaguayPeruPhilippinesPolandPortugalPost-demographic dividendPre-demographic dividendPuerto RicoQatarRomaniaRussian FederationRwandaSaudi ArabiaSenegalSerbiaSeychellesSierra LeoneSingaporeSlovak RepublicSloveniaSmall statesSouth AfricaSouth AsiaSouth Asia (IDA & IBRD)South SudanSpainSri LankaSt. Kitts and NevisSt. LuciaSt. Vincent and the GrenadinesSub-Saharan Africa Sub-Saharan Africa (excluding high income)Sub-Saharan Africa (IDA & IBRD countries)SudanSurinameSwazilandSwedenSwitzerlandTajikistanTanzaniaThailandTimor-LesteTogoTongaTrinidad and TobagoTunisiaTurkeyTurkmenistanUgandaUkraineUnited Arab EmiratesUnited KingdomUnited StatesUpper middle incomeUruguayUzbekistanVanuatuVenezuela, RBVietnamWest Bank and GazaWorldYemen, Rep.ZambiaZimbabwe Timeline:
This timeline shows a graph from 1961 to 2016 of Cameroon. No data until 1960. Number of actual observations by date: 56.
Source name:
World Development Indicators
Source organization:
World Bank national accounts data, and OECD National Accounts data files.
Categories, topics:
Economy & Growth
Last updated:
apr 23, 2017
Indicators value changes by year
Minimum:
397.949 mln
jan 1, 1961
Maximum:
6.345 bln
jan 1, 2016
At the date of observation
Value
Absolute change
Change from previous value
jan 1, 1961
397.949 mln
+397.949 mln
0.0%
jan 1, 1962
408.733 mln
+10.785 mln
2.71%
jan 1, 1963
431.381 mln
+22.648 mln
5.54%
jan 1, 1964
454.028 mln
+22.647 mln
5.25%
jan 1, 1965
492.853 mln
+38.824 mln
8.55%
jan 1, 1966
683.83 mln
+190.977 mln
38.75%
jan 1, 1967
825.312 mln
+141.482 mln
20.69%
jan 1, 1968
741.46 mln
-83.852 mln
-10.16%
jan 1, 1969
747.872 mln
+6.412 mln
0.86%
jan 1, 1970
713.64 mln
-34.232 mln
-4.58%
jan 1, 1971
943.673 mln
+230.033 mln
32.23%
jan 1, 1972
1.153 bln
+209.706 mln
22.22%
jan 1, 1973
1.236 bln
+82.378 mln
7.14%
jan 1, 1974
1.319 bln
+83.459 mln
6.75%
jan 1, 1975
1.21 bln
-109.136 mln
-8.27%
jan 1, 1976
1.414 bln
+204.356 mln
16.89%
jan 1, 1977
1.312 bln
-102.714 mln
-7.26%
jan 1, 1978
1.801 bln
+488.958 mln
37.28%
jan 1, 1979
2.662 bln
+861.6 mln
47.85%
jan 1, 1980
2.55 bln
-112.416 mln
-4.22%
jan 1, 1981
2.832 bln
+281.882 mln
11.05%
jan 1, 1982
4.128 bln
+1.297 bln
45.79%
jan 1, 1983
3.963 bln
-165.613 mln
-4.01%
jan 1, 1984
4.315 bln
+352.409 mln
8.89%
jan 1, 1985
4.686 bln
+370.851 mln
8.59%
jan 1, 1986
5.233 bln
+547.116 mln
11.68%
jan 1, 1987
5.148 bln
-85.263 mln
-1.63%
jan 1, 1988
4.46 bln
-687.772 mln
-13.36%
jan 1, 1989
3.225 bln
-1.235 bln
-27.69%
jan 1, 1990
2.517 bln
-708.565 mln
-21.97%
jan 1, 1991
2.555 bln
+38.877 mln
1.54%
jan 1, 1992
2.397 bln
-158.224 mln
-6.19%
jan 1, 1993
2.021 bln
-376.6 mln
-15.71%
jan 1, 1994
1.858 bln
-162.227 mln
-8.03%
jan 1, 1995
1.835 bln
-23.823 mln
-1.28%
jan 1, 1996
1.723 bln
-111.057 mln
-6.05%
jan 1, 1997
1.876 bln
+152.183 mln
8.83%
jan 1, 1998
2.064 bln
+188.448 mln
10.05%
jan 1, 1999
2.222 bln
+158.263 mln
7.67%
jan 1, 2000
2.324 bln
+101.484 mln
4.57%
jan 1, 2001
2.537 bln
+213.237 mln
9.18%
jan 1, 2002
3.177 bln
+639.868 mln
25.22%
jan 1, 2003
3.092 bln
-84.834 mln
-2.67%
jan 1, 2004
3.13 bln
+38.238 mln
1.24%
jan 1, 2005
3.402 bln
+271.331 mln
8.67%
jan 1, 2006
3.421 bln
+19.341 mln
0.57%
jan 1, 2007
3.507 bln
+85.517 mln
2.5%
jan 1, 2008
3.706 bln
+199.395 mln
5.69%
jan 1, 2009
4.022 bln
+316.496 mln
8.54%
jan 1, 2010
4.26 bln
+237.403 mln
5.9%
jan 1, 2011
4.498 bln
+238.388 mln
5.6%
jan 1, 2012
5.006 bln
+507.382 mln
11.28%
jan 1, 2013
5.1 bln
+94.62 mln
1.89%
jan 1, 2014
5.358 bln
+257.656 mln
5.05%
jan 1, 2015
6.082 bln
+723.945 mln
13.51%
jan 1, 2016
6.345 bln
+263.614 mln
4.33%
Ranking of countries by current statistics by years


Comments: