29
/
en
AIzaSyAYiBZKx7MnpbEhh9jyipgxe19OcubqV5w
April 1, 2024
38188
IDA blend
IDB
false
2
1
Gross capital formation (constant 2010 US$)
2016,2015,2014,2013,2012,2011,2010,2009,2008,2007,2006,2005,2004,2003,2002,2001,2000,1999,1998,1997,1996,1995,1994,1993,1992,1991,1990,1989,1988,1987,1986,1985,1984,1983,1982
This statistics in other country:
AfghanistanAlbaniaAlgeriaAngolaAntigua and BarbudaArab WorldArgentinaArmeniaArubaAustraliaAustriaAzerbaijanBahamas, TheBahrainBangladeshBarbadosBelarusBelgiumBelizeBeninBermudaBhutanBoliviaBosnia and HerzegovinaBotswanaBrazilBrunei DarussalamBulgariaBurkina FasoBurundiCabo VerdeCambodiaCameroonCanadaCaribbean small statesCentral African RepublicCentral Europe and the BalticsChadChileChinaColombiaComorosCongo, Dem. Rep.Congo, Rep.Cote d'IvoireCroatiaCubaCyprusCzech RepublicDenmarkDominicaDominican RepublicEarly-demographic dividendEast Asia & PacificEast Asia & Pacific (excluding high income)East Asia & Pacific (IDA & IBRD countries)EcuadorEgypt, Arab Rep.El SalvadorEquatorial GuineaEritreaEstoniaEthiopiaEuro areaEurope & Central AsiaEurope & Central Asia (excluding high income)Europe & Central Asia (IDA & IBRD countries)European UnionFaroe IslandsFinlandFragile and conflict affected situationsFranceGabonGambia, TheGeorgiaGermanyGhanaGreeceGrenadaGuatemalaGuineaGuinea-BissauGuyanaHaitiHeavily indebted poor countries (HIPC)High incomeHondurasHong Kong SAR, ChinaHungaryIBRD onlyIcelandIDA & IBRD totalIDA blendIDA onlyIDA totalIndiaIndonesiaIran, Islamic Rep.IraqIrelandIsraelItalyJamaicaJapanJordanKazakhstanKenyaKorea, Rep.KosovoKuwaitKyrgyz RepublicLao PDRLate-demographic dividendLatin America & Caribbean Latin America & Caribbean (excluding high income)Latin America & the Caribbean (IDA & IBRD countries)LatviaLeast developed countries: UN classificationLebanonLiberiaLithuaniaLow & middle incomeLow incomeLower middle incomeLuxembourgMacao SAR, ChinaMacedonia, FYRMadagascarMalawiMalaysiaMaliMaltaMauritaniaMauritiusMexicoMiddle East & North AfricaMiddle East & North Africa (excluding high income)Middle East & North Africa (IDA & IBRD countries)Middle incomeMoldovaMongoliaMontenegroMoroccoMozambiqueNamibiaNepalNetherlandsNew ZealandNicaraguaNigerNigeriaNorth AmericaNorwayOECD membersOmanOther small statesPakistanPanamaParaguayPeruPhilippinesPolandPortugalPost-demographic dividendPre-demographic dividendPuerto RicoQatarRomaniaRussian FederationRwandaSaudi ArabiaSenegalSerbiaSeychellesSierra LeoneSingaporeSlovak RepublicSloveniaSmall statesSouth AfricaSouth AsiaSouth Asia (IDA & IBRD)South SudanSpainSri LankaSt. Kitts and NevisSt. LuciaSt. Vincent and the GrenadinesSub-Saharan Africa Sub-Saharan Africa (excluding high income)Sub-Saharan Africa (IDA & IBRD countries)SudanSurinameSwazilandSwedenSwitzerlandTajikistanTanzaniaThailandTimor-LesteTogoTongaTrinidad and TobagoTunisiaTurkeyTurkmenistanUgandaUkraineUnited Arab EmiratesUnited KingdomUnited StatesUpper middle incomeUruguayUzbekistanVanuatuVenezuela, RBVietnamWest Bank and GazaWorldYemen, Rep.ZambiaZimbabwe Timeline:
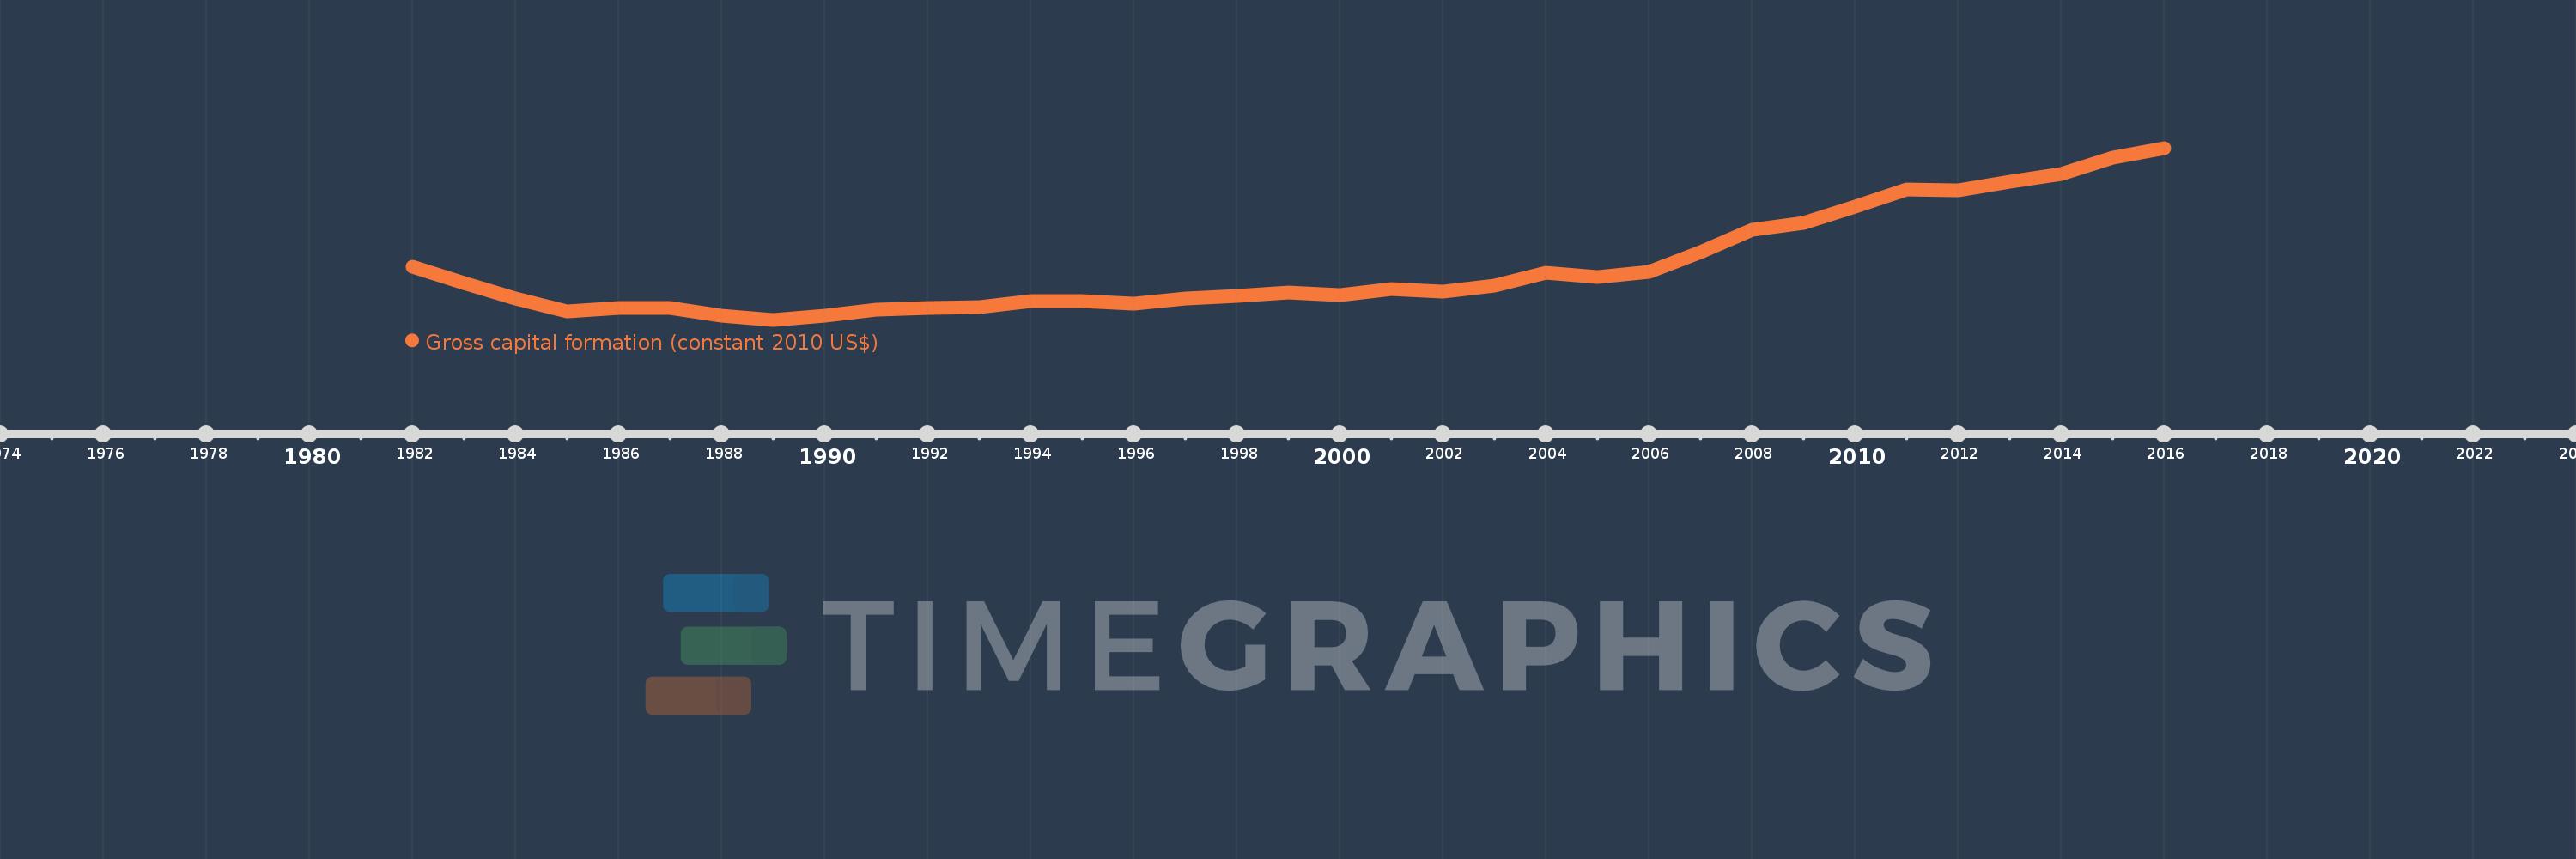
This timeline shows a graph from 1982 to 2016 of IDA blend. No data until 1981. Number of actual observations by date: 35.
Source name:
World Development Indicators
Source organization:
World Bank national accounts data, and OECD National Accounts data files.
Categories, topics:
Economy & Growth
Last updated:
apr 23, 2017
Indicators value changes by year
Minimum:
44.02 bln
jan 1, 1989
Maximum:
225.218 bln
jan 1, 2016
At the date of observation
Value
Absolute change
Change from previous value
jan 1, 1982
99.64 bln
+99.64 bln
0.0%
jan 1, 1983
83.092 bln
-16.548 bln
-16.61%
jan 1, 1984
66.208 bln
-16.883 bln
-20.32%
jan 1, 1985
52.571 bln
-13.637 bln
-20.6%
jan 1, 1986
56.593 bln
+4.022 bln
7.65%
jan 1, 1987
56.535 bln
-58.07 mln
-0.1%
jan 1, 1988
48.348 bln
-8.187 bln
-14.48%
jan 1, 1989
44.02 bln
-4.328 bln
-8.95%
jan 1, 1990
47.938 bln
+3.918 bln
8.9%
jan 1, 1991
54.984 bln
+7.046 bln
14.7%
jan 1, 1992
56.739 bln
+1.755 bln
3.19%
jan 1, 1993
57.721 bln
+982.782 mln
1.73%
jan 1, 1994
63.611 bln
+5.889 bln
10.2%
jan 1, 1995
64.105 bln
+494.386 mln
0.78%
jan 1, 1996
60.566 bln
-3.539 bln
-5.52%
jan 1, 1997
66.49 bln
+5.924 bln
9.78%
jan 1, 1998
68.904 bln
+2.415 bln
3.63%
jan 1, 1999
72.299 bln
+3.395 bln
4.93%
jan 1, 2000
69.911 bln
-2.388 bln
-3.3%
jan 1, 2001
76.342 bln
+6.431 bln
9.2%
jan 1, 2002
73.34 bln
-3.001 bln
-3.93%
jan 1, 2003
79.749 bln
+6.409 bln
8.74%
jan 1, 2004
93.724 bln
+13.975 bln
17.52%
jan 1, 2005
89.191 bln
-4.533 bln
-4.84%
jan 1, 2006
94.446 bln
+5.255 bln
5.89%
jan 1, 2007
115.607 bln
+21.161 bln
22.41%
jan 1, 2008
139.305 bln
+23.698 bln
20.5%
jan 1, 2009
146.144 bln
+6.838 bln
4.91%
jan 1, 2010
162.977 bln
+16.833 bln
11.52%
jan 1, 2011
181.316 bln
+18.339 bln
11.25%
jan 1, 2012
180.549 bln
-766.954 mln
-0.42%
jan 1, 2013
189.196 bln
+8.648 bln
4.79%
jan 1, 2014
198.112 bln
+8.916 bln
4.71%
jan 1, 2015
215.099 bln
+16.987 bln
8.57%
jan 1, 2016
225.218 bln
+10.119 bln
4.7%
Ranking of countries by current statistics by years


Comments: