29
/
en
AIzaSyAYiBZKx7MnpbEhh9jyipgxe19OcubqV5w
April 1, 2024
164884
Jordan
JOR
true
2
1
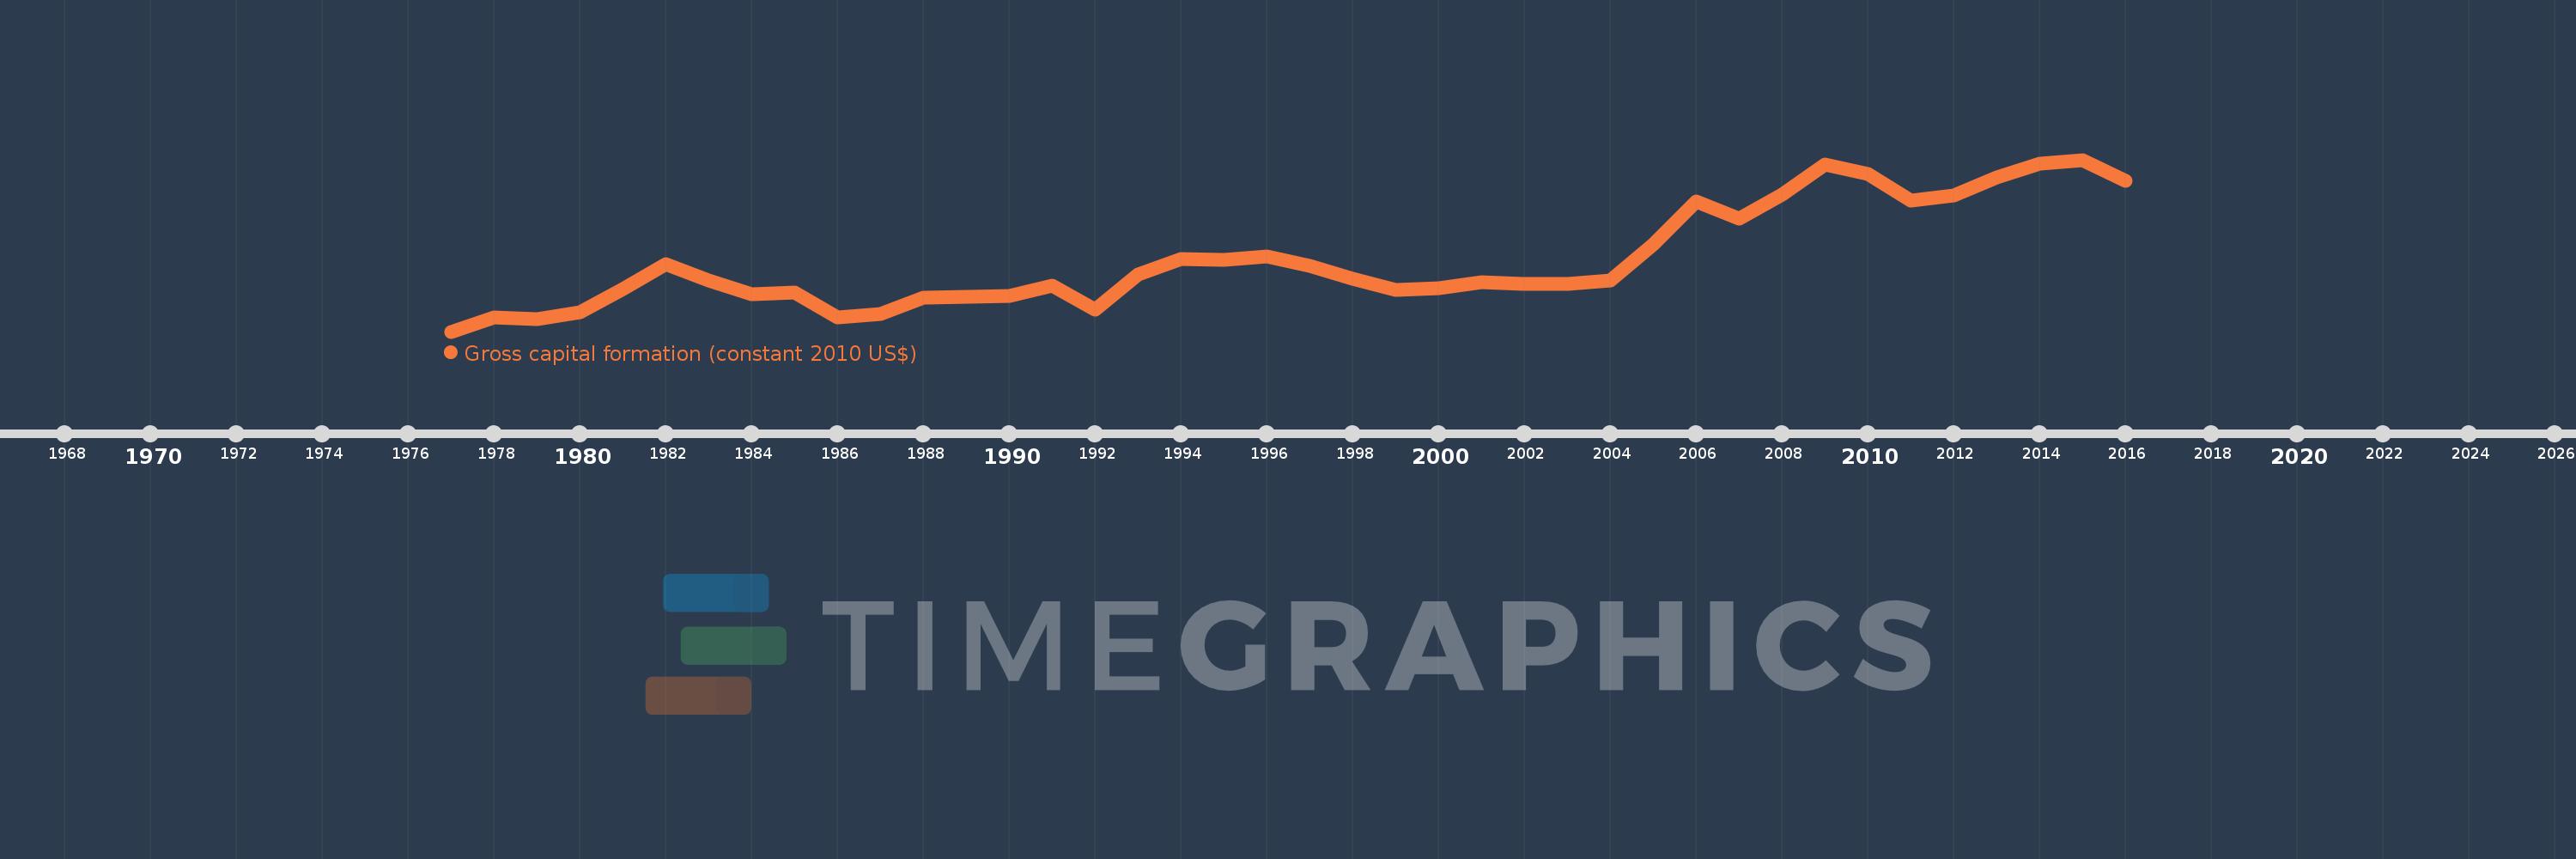
Gross capital formation (constant 2010 US$)
2016,2015,2014,2013,2012,2011,2010,2009,2008,2007,2006,2005,2004,2003,2002,2001,2000,1999,1998,1997,1996,1995,1994,1993,1992,1991,1990,1989,1988,1987,1986,1985,1984,1983,1982,1981,1980,1979,1978,1977
This statistics in other country:
AfghanistanAlbaniaAlgeriaAngolaAntigua and BarbudaArab WorldArgentinaArmeniaArubaAustraliaAustriaAzerbaijanBahamas, TheBahrainBangladeshBarbadosBelarusBelgiumBelizeBeninBermudaBhutanBoliviaBosnia and HerzegovinaBotswanaBrazilBrunei DarussalamBulgariaBurkina FasoBurundiCabo VerdeCambodiaCameroonCanadaCaribbean small statesCentral African RepublicCentral Europe and the BalticsChadChileChinaColombiaComorosCongo, Dem. Rep.Congo, Rep.Cote d'IvoireCroatiaCubaCyprusCzech RepublicDenmarkDominicaDominican RepublicEarly-demographic dividendEast Asia & PacificEast Asia & Pacific (excluding high income)East Asia & Pacific (IDA & IBRD countries)EcuadorEgypt, Arab Rep.El SalvadorEquatorial GuineaEritreaEstoniaEthiopiaEuro areaEurope & Central AsiaEurope & Central Asia (excluding high income)Europe & Central Asia (IDA & IBRD countries)European UnionFaroe IslandsFinlandFragile and conflict affected situationsFranceGabonGambia, TheGeorgiaGermanyGhanaGreeceGrenadaGuatemalaGuineaGuinea-BissauGuyanaHaitiHeavily indebted poor countries (HIPC)High incomeHondurasHong Kong SAR, ChinaHungaryIBRD onlyIcelandIDA & IBRD totalIDA blendIDA onlyIDA totalIndiaIndonesiaIran, Islamic Rep.IraqIrelandIsraelItalyJamaicaJapanJordanKazakhstanKenyaKorea, Rep.KosovoKuwaitKyrgyz RepublicLao PDRLate-demographic dividendLatin America & Caribbean Latin America & Caribbean (excluding high income)Latin America & the Caribbean (IDA & IBRD countries)LatviaLeast developed countries: UN classificationLebanonLiberiaLithuaniaLow & middle incomeLow incomeLower middle incomeLuxembourgMacao SAR, ChinaMacedonia, FYRMadagascarMalawiMalaysiaMaliMaltaMauritaniaMauritiusMexicoMiddle East & North AfricaMiddle East & North Africa (excluding high income)Middle East & North Africa (IDA & IBRD countries)Middle incomeMoldovaMongoliaMontenegroMoroccoMozambiqueNamibiaNepalNetherlandsNew ZealandNicaraguaNigerNigeriaNorth AmericaNorwayOECD membersOmanOther small statesPakistanPanamaParaguayPeruPhilippinesPolandPortugalPost-demographic dividendPre-demographic dividendPuerto RicoQatarRomaniaRussian FederationRwandaSaudi ArabiaSenegalSerbiaSeychellesSierra LeoneSingaporeSlovak RepublicSloveniaSmall statesSouth AfricaSouth AsiaSouth Asia (IDA & IBRD)South SudanSpainSri LankaSt. Kitts and NevisSt. LuciaSt. Vincent and the GrenadinesSub-Saharan Africa Sub-Saharan Africa (excluding high income)Sub-Saharan Africa (IDA & IBRD countries)SudanSurinameSwazilandSwedenSwitzerlandTajikistanTanzaniaThailandTimor-LesteTogoTongaTrinidad and TobagoTunisiaTurkeyTurkmenistanUgandaUkraineUnited Arab EmiratesUnited KingdomUnited StatesUpper middle incomeUruguayUzbekistanVanuatuVenezuela, RBVietnamWest Bank and GazaWorldYemen, Rep.ZambiaZimbabwe Timeline:
This timeline shows a graph from 1977 to 2016 of Jordan. No data until 1976. Number of actual observations by date: 40.
Source name:
World Development Indicators
Source organization:
World Bank national accounts data, and OECD National Accounts data files.
Categories, topics:
Economy & Growth
Last updated:
apr 23, 2017
Indicators value changes by year
Minimum:
1.603 bln
jan 1, 1977
Maximum:
7.828 bln
jan 1, 2015
At the date of observation
Value
Absolute change
Change from previous value
jan 1, 1977
1.603 bln
+1.603 bln
0.0%
jan 1, 1978
2.132 bln
+528.562 mln
32.97%
jan 1, 1979
2.059 bln
-72.396 mln
-3.4%
jan 1, 1980
2.299 bln
+239.542 mln
11.63%
jan 1, 1981
3.139 bln
+840.751 mln
36.57%
jan 1, 1982
4.041 bln
+902.019 mln
28.73%
jan 1, 1983
3.446 bln
-595.672 mln
-14.74%
jan 1, 1984
2.962 bln
-483.881 mln
-14.04%
jan 1, 1985
3.017 bln
+54.574 mln
1.84%
jan 1, 1986
2.129 bln
-887.329 mln
-29.42%
jan 1, 1987
2.238 bln
+108.49 mln
5.1%
jan 1, 1988
2.83 bln
+592.271 mln
26.47%
jan 1, 1989
2.869 bln
+39.105 mln
1.38%
jan 1, 1990
2.887 bln
+18.078 mln
0.63%
jan 1, 1991
3.273 bln
+385.528 mln
13.35%
jan 1, 1992
2.386 bln
-886.961 mln
-27.1%
jan 1, 1993
3.687 bln
+1.301 bln
54.53%
jan 1, 1994
4.248 bln
+561.684 mln
15.24%
jan 1, 1995
4.205 bln
-43.11 mln
-1.01%
jan 1, 1996
4.337 bln
+131.722 mln
3.13%
jan 1, 1997
3.998 bln
-338.803 mln
-7.81%
jan 1, 1998
3.523 bln
-475.188 mln
-11.89%
jan 1, 1999
3.098 bln
-424.648 mln
-12.05%
jan 1, 2000
3.184 bln
+85.304 mln
2.75%
jan 1, 2001
3.382 bln
+198.656 mln
6.24%
jan 1, 2002
3.331 bln
-50.926 mln
-1.51%
jan 1, 2003
3.338 bln
+6.7 mln
0.2%
jan 1, 2004
3.47 bln
+131.744 mln
3.95%
jan 1, 2005
4.756 bln
+1.286 bln
37.06%
jan 1, 2006
6.307 bln
+1.552 bln
32.63%
jan 1, 2007
5.705 bln
-602.265 mln
-9.55%
jan 1, 2008
6.557 bln
+851.433 mln
14.92%
jan 1, 2009
7.644 bln
+1.088 bln
16.59%
jan 1, 2010
7.325 bln
-319.544 mln
-4.18%
jan 1, 2011
6.348 bln
-977.0 mln
-13.34%
jan 1, 2012
6.549 bln
+201.602 mln
3.18%
jan 1, 2013
7.196 bln
+646.837 mln
9.88%
jan 1, 2014
7.682 bln
+486.351 mln
6.76%
jan 1, 2015
7.828 bln
+145.098 mln
1.89%
jan 1, 2016
7.078 bln
-749.557 mln
-9.58%
Ranking of countries by current statistics by years


Comments: