29
/
en
AIzaSyAYiBZKx7MnpbEhh9jyipgxe19OcubqV5w
April 1, 2024
275734
United Kingdom
GBR
true
2
1
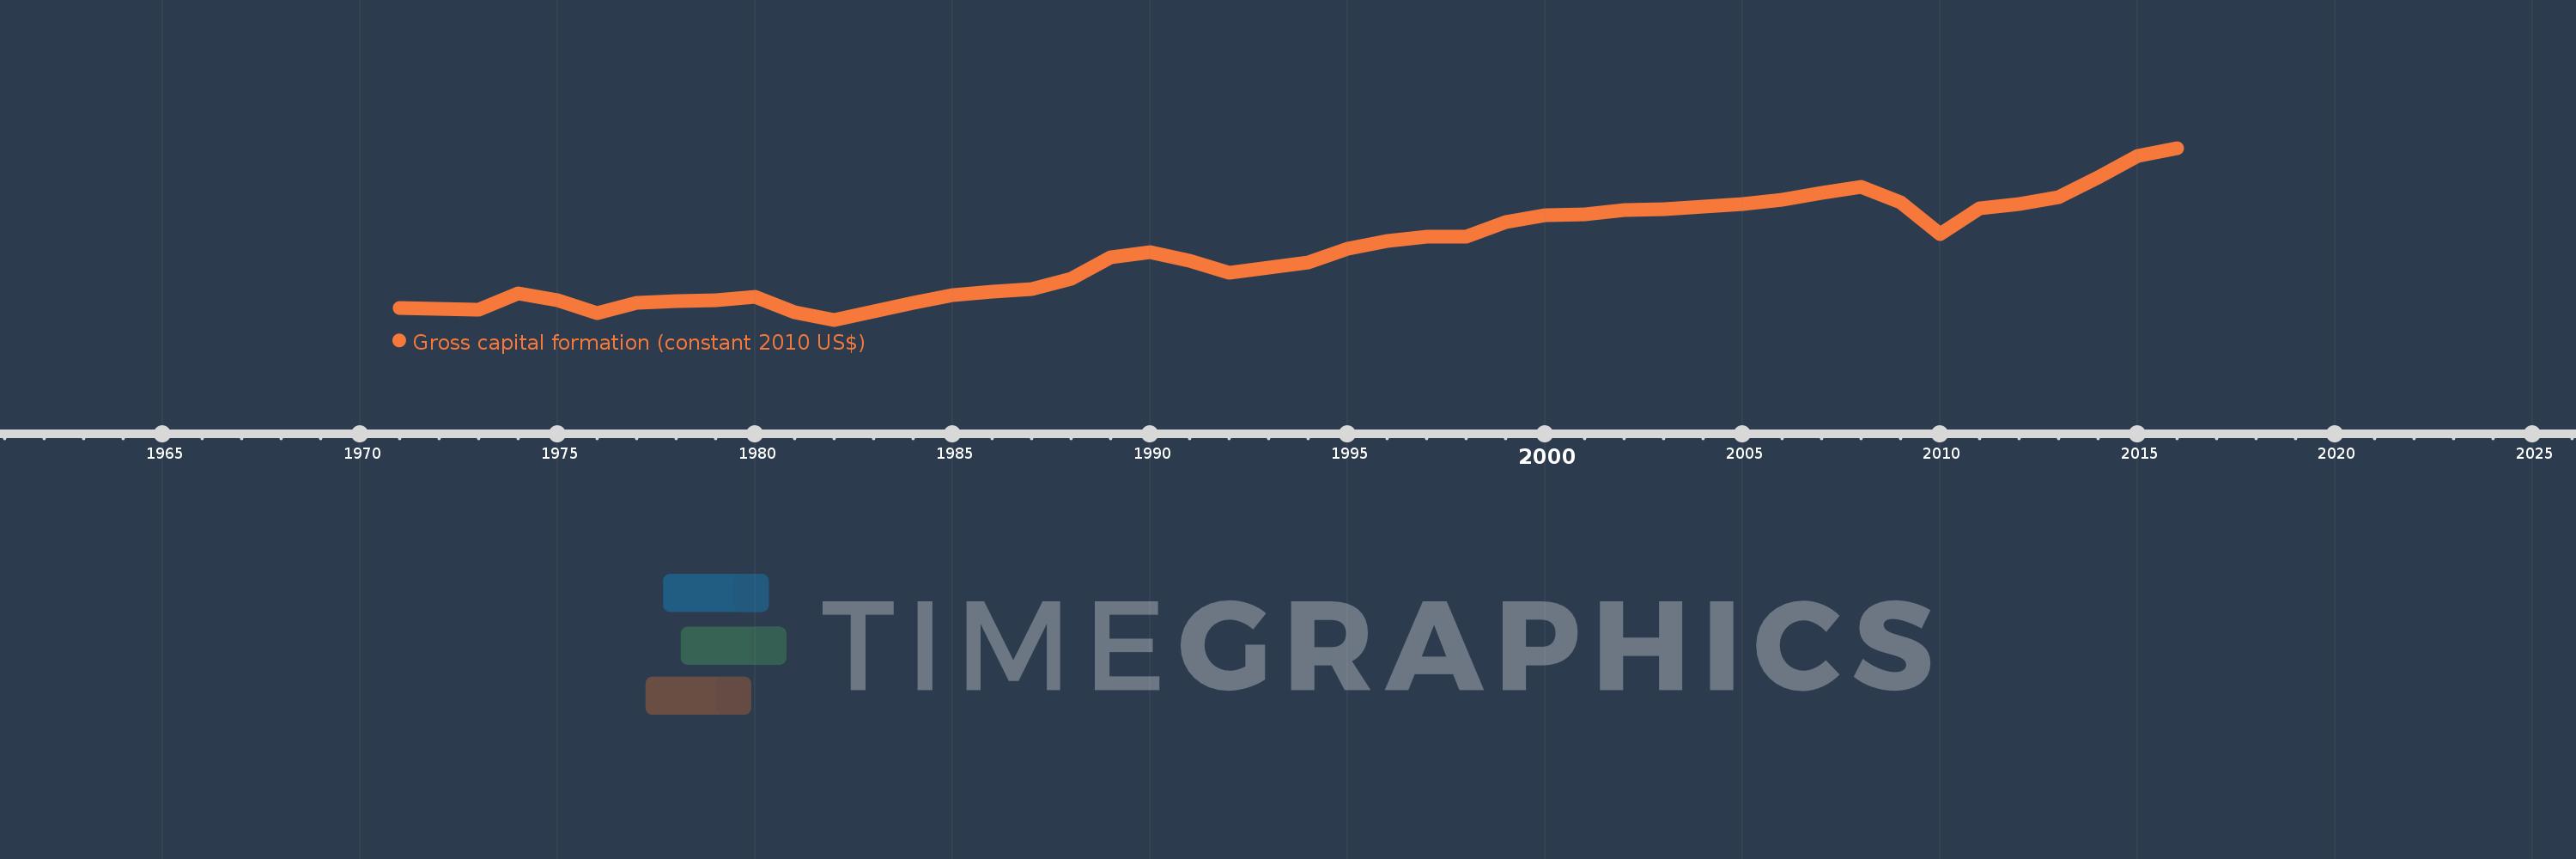
Gross capital formation (constant 2010 US$)
2016,2015,2014,2013,2012,2011,2010,2009,2008,2007,2006,2005,2004,2003,2002,2001,2000,1999,1998,1997,1996,1995,1994,1993,1992,1991,1990,1989,1988,1987,1986,1985,1984,1983,1982,1981,1980,1979,1978,1977,1976,1975,1974,1973,1972,1971
This statistics in other country:
AfghanistanAlbaniaAlgeriaAngolaAntigua and BarbudaArab WorldArgentinaArmeniaArubaAustraliaAustriaAzerbaijanBahamas, TheBahrainBangladeshBarbadosBelarusBelgiumBelizeBeninBermudaBhutanBoliviaBosnia and HerzegovinaBotswanaBrazilBrunei DarussalamBulgariaBurkina FasoBurundiCabo VerdeCambodiaCameroonCanadaCaribbean small statesCentral African RepublicCentral Europe and the BalticsChadChileChinaColombiaComorosCongo, Dem. Rep.Congo, Rep.Cote d'IvoireCroatiaCubaCyprusCzech RepublicDenmarkDominicaDominican RepublicEarly-demographic dividendEast Asia & PacificEast Asia & Pacific (excluding high income)East Asia & Pacific (IDA & IBRD countries)EcuadorEgypt, Arab Rep.El SalvadorEquatorial GuineaEritreaEstoniaEthiopiaEuro areaEurope & Central AsiaEurope & Central Asia (excluding high income)Europe & Central Asia (IDA & IBRD countries)European UnionFaroe IslandsFinlandFragile and conflict affected situationsFranceGabonGambia, TheGeorgiaGermanyGhanaGreeceGrenadaGuatemalaGuineaGuinea-BissauGuyanaHaitiHeavily indebted poor countries (HIPC)High incomeHondurasHong Kong SAR, ChinaHungaryIBRD onlyIcelandIDA & IBRD totalIDA blendIDA onlyIDA totalIndiaIndonesiaIran, Islamic Rep.IraqIrelandIsraelItalyJamaicaJapanJordanKazakhstanKenyaKorea, Rep.KosovoKuwaitKyrgyz RepublicLao PDRLate-demographic dividendLatin America & Caribbean Latin America & Caribbean (excluding high income)Latin America & the Caribbean (IDA & IBRD countries)LatviaLeast developed countries: UN classificationLebanonLiberiaLithuaniaLow & middle incomeLow incomeLower middle incomeLuxembourgMacao SAR, ChinaMacedonia, FYRMadagascarMalawiMalaysiaMaliMaltaMauritaniaMauritiusMexicoMiddle East & North AfricaMiddle East & North Africa (excluding high income)Middle East & North Africa (IDA & IBRD countries)Middle incomeMoldovaMongoliaMontenegroMoroccoMozambiqueNamibiaNepalNetherlandsNew ZealandNicaraguaNigerNigeriaNorth AmericaNorwayOECD membersOmanOther small statesPakistanPanamaParaguayPeruPhilippinesPolandPortugalPost-demographic dividendPre-demographic dividendPuerto RicoQatarRomaniaRussian FederationRwandaSaudi ArabiaSenegalSerbiaSeychellesSierra LeoneSingaporeSlovak RepublicSloveniaSmall statesSouth AfricaSouth AsiaSouth Asia (IDA & IBRD)South SudanSpainSri LankaSt. Kitts and NevisSt. LuciaSt. Vincent and the GrenadinesSub-Saharan Africa Sub-Saharan Africa (excluding high income)Sub-Saharan Africa (IDA & IBRD countries)SudanSurinameSwazilandSwedenSwitzerlandTajikistanTanzaniaThailandTimor-LesteTogoTongaTrinidad and TobagoTunisiaTurkeyTurkmenistanUgandaUkraineUnited Arab EmiratesUnited KingdomUnited StatesUpper middle incomeUruguayUzbekistanVanuatuVenezuela, RBVietnamWest Bank and GazaWorldYemen, Rep.ZambiaZimbabwe Timeline:
This timeline shows a graph from 1971 to 2016 of United Kingdom. No data until 1970. Number of actual observations by date: 46.
Source name:
World Development Indicators
Source organization:
World Bank national accounts data, and OECD National Accounts data files.
Categories, topics:
Economy & Growth
Last updated:
apr 23, 2017
Indicators value changes by year
Minimum:
158.9 bln
jan 1, 1982
Maximum:
513.003 bln
jan 1, 2016
At the date of observation
Value
Absolute change
Change from previous value
jan 1, 1971
182.434 bln
+182.434 bln
0.0%
jan 1, 1972
181.377 bln
-1.058 bln
-0.58%
jan 1, 1973
179.155 bln
-2.222 bln
-1.22%
jan 1, 1974
214.136 bln
+34.981 bln
19.53%
jan 1, 1975
198.233 bln
-15.903 bln
-7.43%
jan 1, 1976
173.215 bln
-25.018 bln
-12.62%
jan 1, 1977
193.297 bln
+20.081 bln
11.59%
jan 1, 1978
196.453 bln
+3.156 bln
1.63%
jan 1, 1979
199.253 bln
+2.8 bln
1.43%
jan 1, 1980
205.738 bln
+6.485 bln
3.25%
jan 1, 1981
174.545 bln
-31.194 bln
-15.16%
jan 1, 1982
158.9 bln
-15.644 bln
-8.96%
jan 1, 1983
175.534 bln
+16.634 bln
10.47%
jan 1, 1984
193.805 bln
+18.271 bln
10.41%
jan 1, 1985
209.882 bln
+16.077 bln
8.3%
jan 1, 1986
217.353 bln
+7.471 bln
3.56%
jan 1, 1987
222.56 bln
+5.207 bln
2.4%
jan 1, 1988
244.111 bln
+21.551 bln
9.68%
jan 1, 1989
288.06 bln
+43.949 bln
18.0%
jan 1, 1990
299.065 bln
+11.005 bln
3.82%
jan 1, 1991
280.863 bln
-18.202 bln
-6.09%
jan 1, 1992
255.975 bln
-24.888 bln
-8.86%
jan 1, 1993
266.404 bln
+10.429 bln
4.07%
jan 1, 1994
276.434 bln
+10.03 bln
3.77%
jan 1, 1995
305.101 bln
+28.667 bln
10.37%
jan 1, 1996
320.679 bln
+15.578 bln
5.11%
jan 1, 1997
329.653 bln
+8.974 bln
2.8%
jan 1, 1998
330.962 bln
+1.309 bln
0.4%
jan 1, 1999
360.034 bln
+29.072 bln
8.78%
jan 1, 2000
373.647 bln
+13.613 bln
3.78%
jan 1, 2001
376.452 bln
+2.804 bln
0.75%
jan 1, 2002
384.928 bln
+8.477 bln
2.25%
jan 1, 2003
386.607 bln
+1.679 bln
0.44%
jan 1, 2004
392.771 bln
+6.164 bln
1.59%
jan 1, 2005
396.531 bln
+3.76 bln
0.96%
jan 1, 2006
405.399 bln
+8.868 bln
2.24%
jan 1, 2007
421.172 bln
+15.774 bln
3.89%
jan 1, 2008
433.492 bln
+12.319 bln
2.93%
jan 1, 2009
401.21 bln
-32.281 bln
-7.45%
jan 1, 2010
335.724 bln
-65.486 bln
-16.32%
jan 1, 2011
388.161 bln
+52.437 bln
15.62%
jan 1, 2012
397.22 bln
+9.058 bln
2.33%
jan 1, 2013
411.98 bln
+14.76 bln
3.72%
jan 1, 2014
453.053 bln
+41.073 bln
9.97%
jan 1, 2015
495.8 bln
+42.747 bln
9.44%
jan 1, 2016
513.003 bln
+17.203 bln
3.47%
Ranking of countries by current statistics by years


Comments: