29
/
en
AIzaSyAYiBZKx7MnpbEhh9jyipgxe19OcubqV5w
April 1, 2024
70625
Argentina
ARG
true
2
1
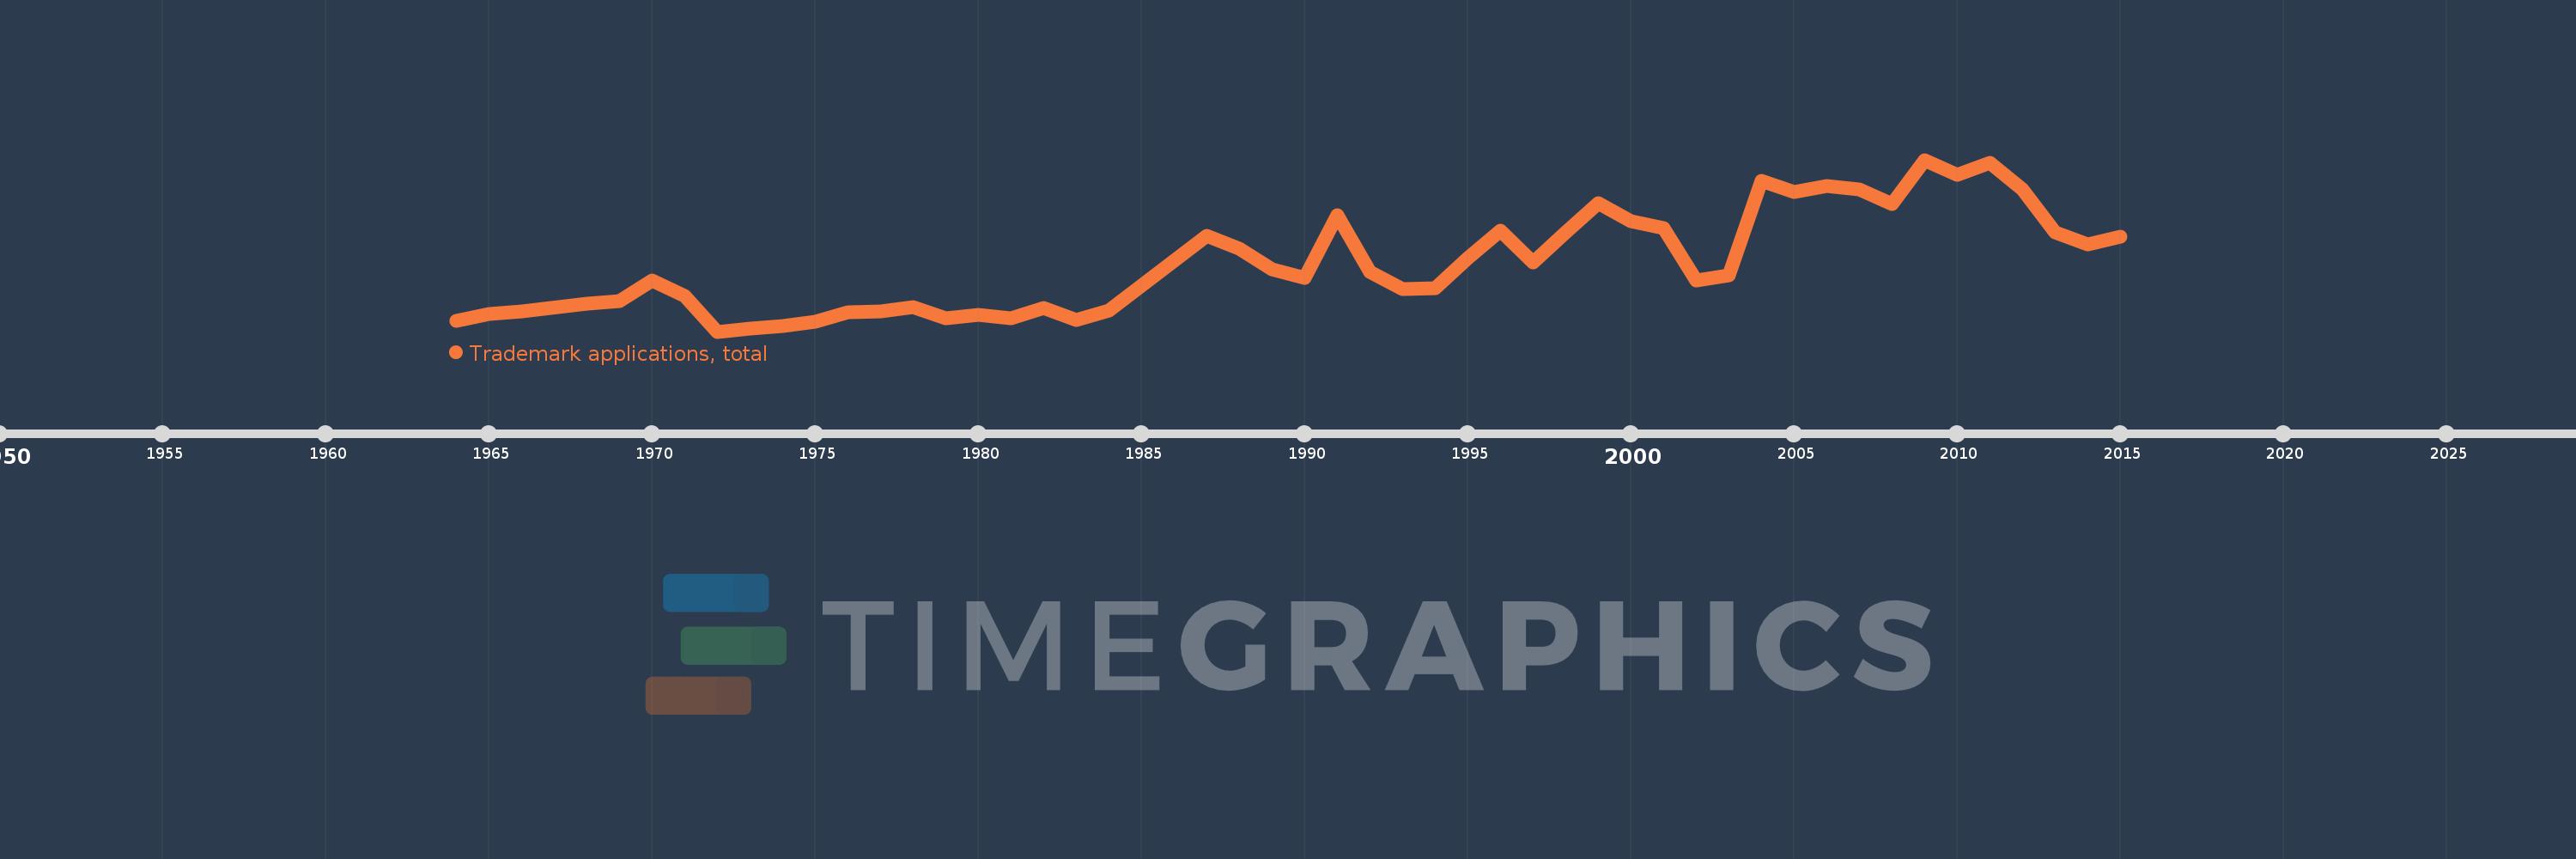
Trademark applications, total
2015,2014,2013,2012,2011,2010,2009,2008,2007,2006,2005,2004,2003,2002,2001,2000,1999,1998,1997,1996,1995,1994,1993,1992,1991,1990,1989,1988,1987,1984,1983,1982,1981,1980,1979,1978,1977,1976,1975,1974,1973,1972,1971,1970,1969,1968,1966,1965,1964
This statistics in other country:
AlbaniaAlgeriaAndorraAngolaAntigua and BarbudaArab WorldArgentinaArmeniaArubaAustraliaAustriaAzerbaijanBahamas, TheBahrainBangladeshBarbadosBelarusBelgiumBelizeBhutanBoliviaBosnia and HerzegovinaBotswanaBrazilBrunei DarussalamBulgariaBurkina FasoBurundiCabo VerdeCambodiaCanadaCaribbean small statesCentral Europe and the BalticsChileChinaColombiaComorosCongo, Dem. Rep.Costa RicaCroatiaCubaCuracaoCyprusCzech RepublicDenmarkDjiboutiDominicaDominican RepublicEarly-demographic dividendEast Asia & PacificEast Asia & Pacific (excluding high income)East Asia & Pacific (IDA & IBRD countries)EcuadorEgypt, Arab Rep.El SalvadorEquatorial GuineaEstoniaEthiopiaEuro areaEurope & Central AsiaEurope & Central Asia (excluding high income)Europe & Central Asia (IDA & IBRD countries)European UnionFijiFinlandFranceGambia, TheGeorgiaGermanyGhanaGreeceGrenadaGuatemalaGuineaGuinea-BissauGuyanaHaitiHigh incomeHondurasHong Kong SAR, ChinaHungaryIBRD onlyIcelandIDA & IBRD totalIDA blendIDA onlyIDA totalIndiaIndonesiaIran, Islamic Rep.IraqIrelandIsraelItalyJamaicaJapanJordanKazakhstanKenyaKiribatiKorea, Dem. People’s Rep.Korea, Rep.KuwaitKyrgyz RepublicLao PDRLate-demographic dividendLatin America & Caribbean Latin America & Caribbean (excluding high income)Latin America & the Caribbean (IDA & IBRD countries)LatviaLeast developed countries: UN classificationLebanonLesothoLiberiaLibyaLiechtensteinLithuaniaLow & middle incomeLower middle incomeLuxembourgMacao SAR, ChinaMacedonia, FYRMadagascarMalawiMalaysiaMaldivesMaliMaltaMauritiusMexicoMiddle East & North AfricaMiddle East & North Africa (excluding high income)Middle East & North Africa (IDA & IBRD countries)Middle incomeMoldovaMonacoMongoliaMontenegroMoroccoMozambiqueMyanmarNamibiaNepalNetherlandsNew ZealandNicaraguaNigeriaNorth AmericaNorwayOECD membersOmanOther small statesPacific island small statesPakistanPanamaPapua New GuineaParaguayPeruPhilippinesPolandPortugalPost-demographic dividendQatarRomaniaRussian FederationRwandaSamoaSan MarinoSao Tome and PrincipeSaudi ArabiaSerbiaSeychellesSierra LeoneSingaporeSint Maarten (Dutch part)Slovak RepublicSloveniaSmall statesSolomon IslandsSomaliaSouth AfricaSouth AsiaSouth Asia (IDA & IBRD)SpainSri LankaSt. LuciaSt. Vincent and the GrenadinesSudanSurinameSwazilandSwedenSwitzerlandSyrian Arab RepublicTajikistanTanzaniaThailandTongaTrinidad and TobagoTunisiaTurkeyTurkmenistanTuvaluUgandaUkraineUnited Arab EmiratesUnited KingdomUnited StatesUpper middle incomeUruguayUzbekistanVenezuela, RBVietnamWorldYemen, Rep.ZambiaZimbabwe Timeline:
This timeline shows a graph from 1964 to 2015 of Argentina. No data until 1963. Number of actual observations by date: 49.
Source name:
World Development Indicators
Source organization:
World Intellectual Property Organization (WIPO), World Intellectual Property Indicators and www.wipo.int/econ_stat. The International Bureau of WIPO assumes no responsibility with respect to the transformation of these data.
Categories, topics:
Science & Technology
Last updated:
apr 23, 2017
Indicators value changes by year
Minimum:
20.008K
jan 1, 1972
Maximum:
89.629K
jan 1, 2009
At the date of observation
Value
Absolute change
Change from previous value
jan 1, 1964
24.24K
+24.24K
0.0%
jan 1, 1965
27.206K
+2.966K
12.24%
jan 1, 1966
28.225K
+1.019K
3.75%
jan 1, 1968
31.279K
+3.054K
10.82%
jan 1, 1969
32.223K
+944.0
3.02%
jan 1, 1970
40.73K
+8.507K
26.4%
jan 1, 1971
34.384K
-6.346K
-15.58%
jan 1, 1972
20.008K
-14.376K
-41.81%
jan 1, 1973
21.4K
+1.392K
6.96%
jan 1, 1974
22.135K
+735.0
3.43%
jan 1, 1975
24.015K
+1.88K
8.49%
jan 1, 1976
27.667K
+3.652K
15.21%
jan 1, 1977
28.02K
+353.0
1.28%
jan 1, 1978
29.89K
+1.87K
6.67%
jan 1, 1979
25.464K
-4.426K
-14.81%
jan 1, 1980
26.911K
+1.447K
5.68%
jan 1, 1981
25.316K
-1.595K
-5.93%
jan 1, 1982
29.742K
+4.426K
17.48%
jan 1, 1983
24.616K
-5.126K
-17.23%
jan 1, 1984
28.363K
+3.747K
15.22%
jan 1, 1987
58.65K
+30.287K
106.78%
jan 1, 1988
53.717K
-4.933K
-8.41%
jan 1, 1989
45.257K
-8.46K
-15.75%
jan 1, 1990
41.605K
-3.652K
-8.07%
jan 1, 1991
67.053K
+25.448K
61.17%
jan 1, 1992
44.357K
-22.696K
-33.85%
jan 1, 1993
37.345K
-7.012K
-15.81%
jan 1, 1994
37.687K
+342.0
0.92%
jan 1, 1995
49.867K
+12.18K
32.32%
jan 1, 1996
60.884K
+11.017K
22.09%
jan 1, 1997
47.972K
-12.912K
-21.21%
jan 1, 1998
60.194K
+12.222K
25.48%
jan 1, 1999
72.008K
+11.814K
19.63%
jan 1, 2000
64.719K
-7.289K
-10.12%
jan 1, 2001
61.847K
-2.872K
-4.44%
jan 1, 2002
40.583K
-21.264K
-34.38%
jan 1, 2003
42.812K
+2.229K
5.49%
jan 1, 2004
81.216K
+38.404K
89.7%
jan 1, 2005
76.431K
-4.785K
-5.89%
jan 1, 2006
79.018K
+2.587K
3.38%
jan 1, 2007
77.711K
-1.307K
-1.65%
jan 1, 2008
71.559K
-6.152K
-7.92%
jan 1, 2009
89.629K
+18.07K
25.25%
jan 1, 2010
83.683K
-5.946K
-6.63%
jan 1, 2011
88.428K
+4.745K
5.67%
jan 1, 2012
77.494K
-10.934K
-12.36%
jan 1, 2013
60.17K
-17.324K
-22.36%
jan 1, 2014
55.295K
-4.875K
-8.1%
jan 1, 2015
58.486K
+3.191K
5.77%
Ranking of countries by current statistics by years


Comments: