29
/
en
AIzaSyAYiBZKx7MnpbEhh9jyipgxe19OcubqV5w
April 1, 2024
207544
Nepal
NPL
true
2
1
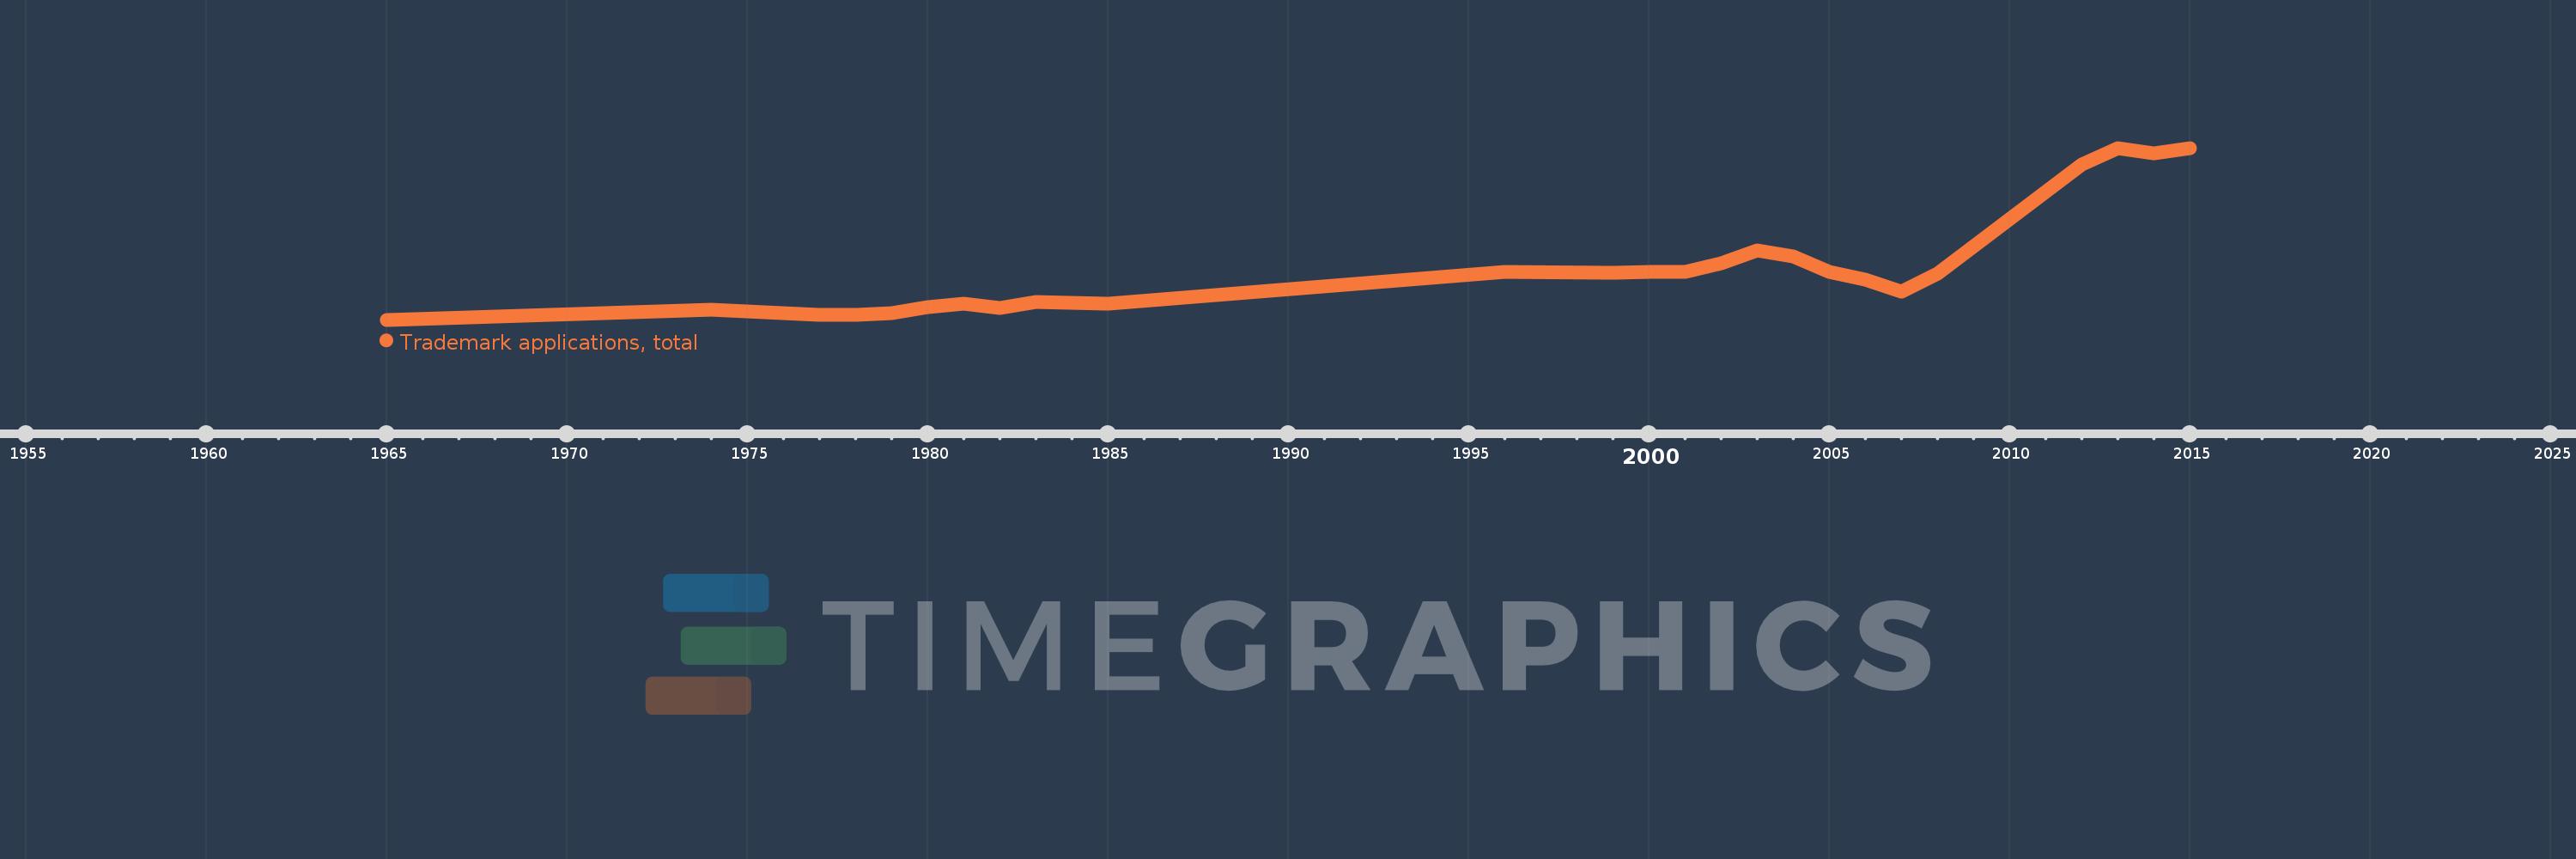
Trademark applications, total
2015,2014,2013,2012,2008,2007,2006,2005,2004,2003,2002,2001,2000,1999,1996,1985,1983,1982,1981,1980,1979,1978,1977,1974,1965
This statistics in other country:
AlbaniaAlgeriaAndorraAngolaAntigua and BarbudaArab WorldArgentinaArmeniaArubaAustraliaAustriaAzerbaijanBahamas, TheBahrainBangladeshBarbadosBelarusBelgiumBelizeBhutanBoliviaBosnia and HerzegovinaBotswanaBrazilBrunei DarussalamBulgariaBurkina FasoBurundiCabo VerdeCambodiaCanadaCaribbean small statesCentral Europe and the BalticsChileChinaColombiaComorosCongo, Dem. Rep.Costa RicaCroatiaCubaCuracaoCyprusCzech RepublicDenmarkDjiboutiDominicaDominican RepublicEarly-demographic dividendEast Asia & PacificEast Asia & Pacific (excluding high income)East Asia & Pacific (IDA & IBRD countries)EcuadorEgypt, Arab Rep.El SalvadorEquatorial GuineaEstoniaEthiopiaEuro areaEurope & Central AsiaEurope & Central Asia (excluding high income)Europe & Central Asia (IDA & IBRD countries)European UnionFijiFinlandFranceGambia, TheGeorgiaGermanyGhanaGreeceGrenadaGuatemalaGuineaGuinea-BissauGuyanaHaitiHigh incomeHondurasHong Kong SAR, ChinaHungaryIBRD onlyIcelandIDA & IBRD totalIDA blendIDA onlyIDA totalIndiaIndonesiaIran, Islamic Rep.IraqIrelandIsraelItalyJamaicaJapanJordanKazakhstanKenyaKiribatiKorea, Dem. People’s Rep.Korea, Rep.KuwaitKyrgyz RepublicLao PDRLate-demographic dividendLatin America & Caribbean Latin America & Caribbean (excluding high income)Latin America & the Caribbean (IDA & IBRD countries)LatviaLeast developed countries: UN classificationLebanonLesothoLiberiaLibyaLiechtensteinLithuaniaLow & middle incomeLower middle incomeLuxembourgMacao SAR, ChinaMacedonia, FYRMadagascarMalawiMalaysiaMaldivesMaliMaltaMauritiusMexicoMiddle East & North AfricaMiddle East & North Africa (excluding high income)Middle East & North Africa (IDA & IBRD countries)Middle incomeMoldovaMonacoMongoliaMontenegroMoroccoMozambiqueMyanmarNamibiaNepalNetherlandsNew ZealandNicaraguaNigeriaNorth AmericaNorwayOECD membersOmanOther small statesPacific island small statesPakistanPanamaPapua New GuineaParaguayPeruPhilippinesPolandPortugalPost-demographic dividendQatarRomaniaRussian FederationRwandaSamoaSan MarinoSao Tome and PrincipeSaudi ArabiaSerbiaSeychellesSierra LeoneSingaporeSint Maarten (Dutch part)Slovak RepublicSloveniaSmall statesSolomon IslandsSomaliaSouth AfricaSouth AsiaSouth Asia (IDA & IBRD)SpainSri LankaSt. LuciaSt. Vincent and the GrenadinesSudanSurinameSwazilandSwedenSwitzerlandSyrian Arab RepublicTajikistanTanzaniaThailandTongaTrinidad and TobagoTunisiaTurkeyTurkmenistanTuvaluUgandaUkraineUnited Arab EmiratesUnited KingdomUnited StatesUpper middle incomeUruguayUzbekistanVenezuela, RBVietnamWorldYemen, Rep.ZambiaZimbabwe Timeline:
This timeline shows a graph from 1965 to 2015 of Nepal. No data until 1964. Number of actual observations by date: 25.
Source name:
World Development Indicators
Source organization:
World Intellectual Property Organization (WIPO), World Intellectual Property Indicators and www.wipo.int/econ_stat. The International Bureau of WIPO assumes no responsibility with respect to the transformation of these data.
Categories, topics:
Science & Technology
Last updated:
apr 23, 2017
Indicators value changes by year
Maximum:
3.961K
jan 1, 2013
At the date of observation
Value
Absolute change
Change from previous value
jan 1, 1965
96.0
+96.0
0.0%
jan 1, 1974
330.0
+234.0
243.75%
jan 1, 1977
207.0
-123.0
-37.27%
jan 1, 1978
214.0
+7.0
3.38%
jan 1, 1979
242.0
+28.0
13.08%
jan 1, 1980
375.0
+133.0
54.96%
jan 1, 1981
466.0
+91.0
24.27%
jan 1, 1982
352.0
-114.0
-24.46%
jan 1, 1983
487.0
+135.0
38.35%
jan 1, 1985
457.0
-30.0
-6.16%
jan 1, 1996
1.167K
+710.0
155.36%
jan 1, 1999
1.159K
-8.0
-0.69%
jan 1, 2000
1.163K
+4.0
0.35%
jan 1, 2001
1.175K
+12.0
1.03%
jan 1, 2002
1.361K
+186.0
15.83%
jan 1, 2003
1.651K
+290.0
21.31%
jan 1, 2004
1.516K
-135.0
-8.18%
jan 1, 2005
1.174K
-342.0
-22.56%
jan 1, 2006
1.004K
-170.0
-14.48%
jan 1, 2007
723.0
-281.0
-27.99%
jan 1, 2008
1.132K
+409.0
56.57%
jan 1, 2012
3.583K
+2.451K
216.52%
jan 1, 2013
3.961K
+378.0
10.55%
jan 1, 2014
3.832K
-129.0
-3.26%
jan 1, 2015
3.95K
+118.0
3.08%
Ranking of countries by current statistics by years


Comments: