29
/
en
AIzaSyAYiBZKx7MnpbEhh9jyipgxe19OcubqV5w
April 1, 2024
273073
Uganda
UGA
true
2
1
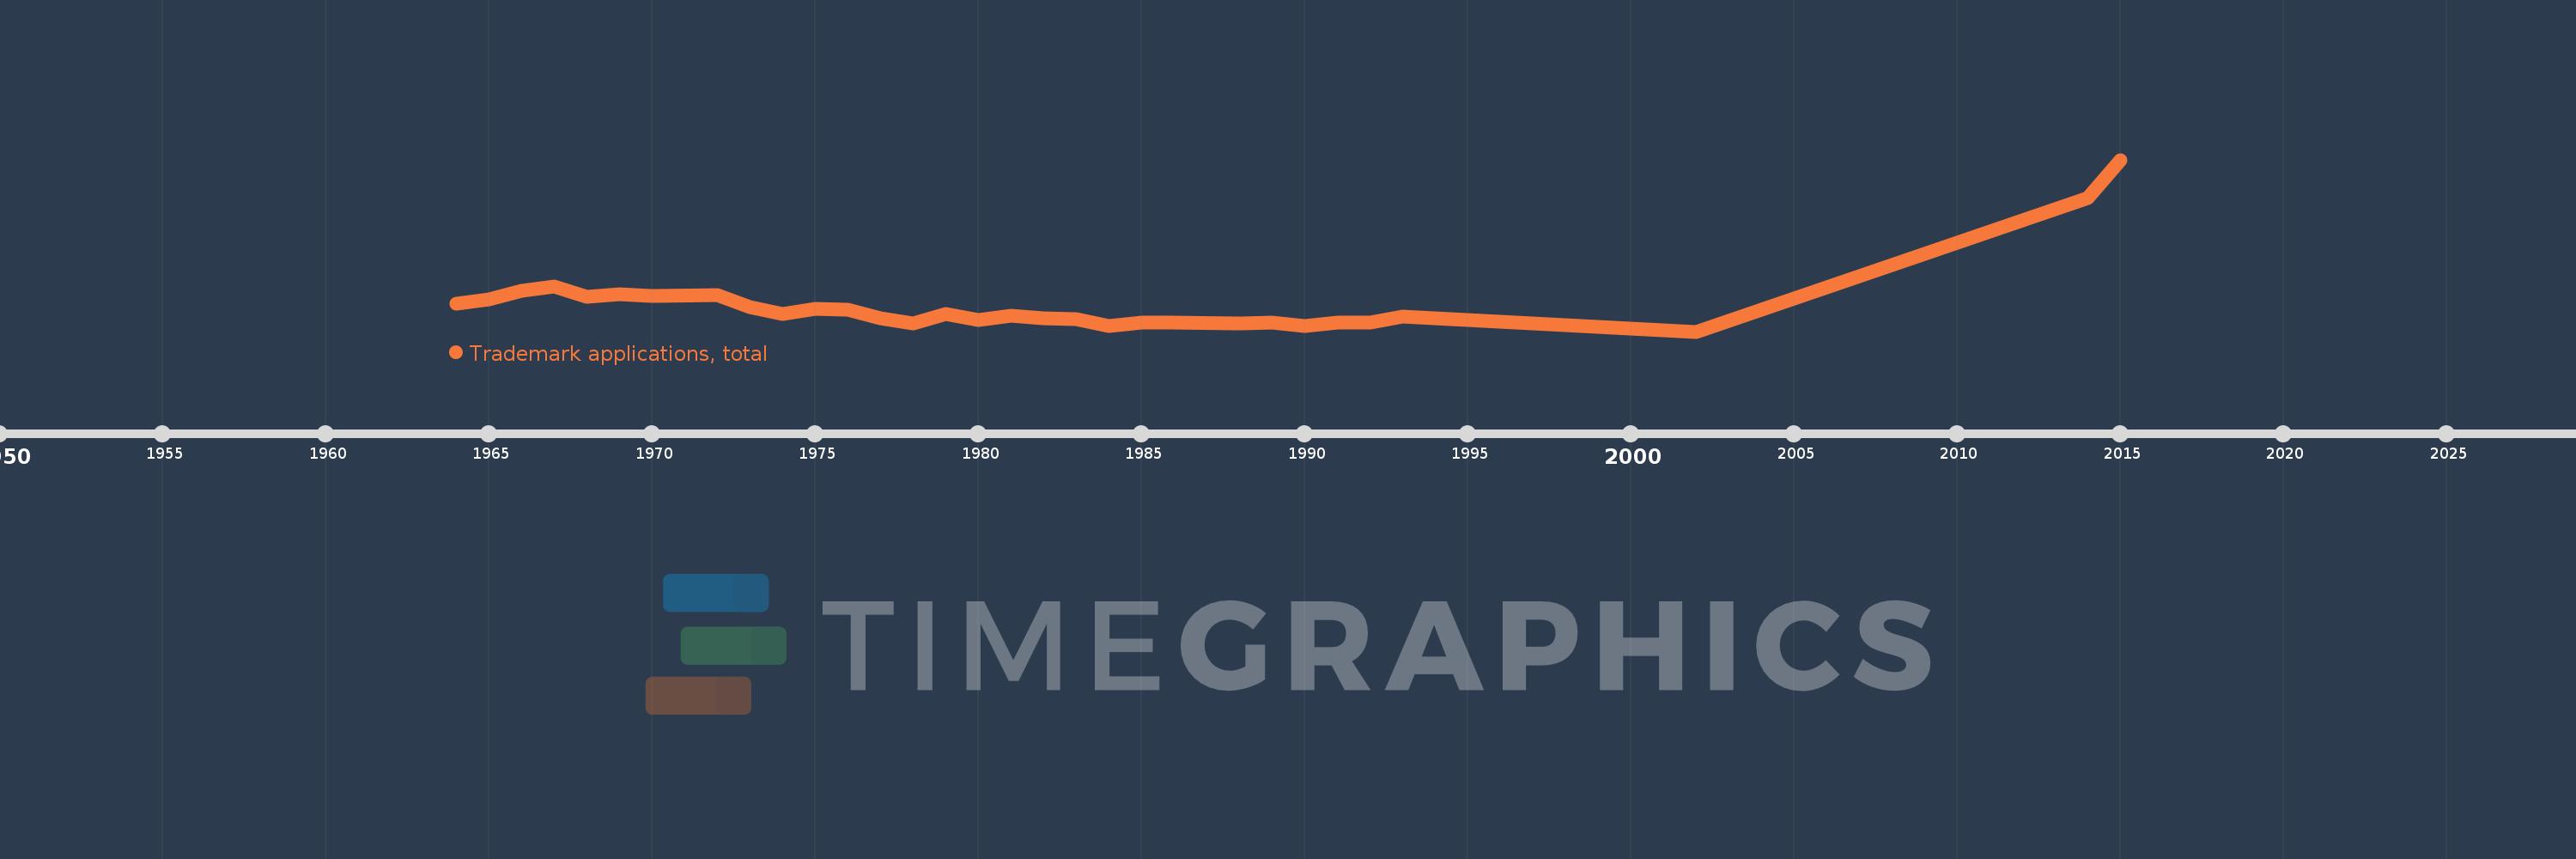
Trademark applications, total
2015,2014,2002,1993,1992,1991,1990,1989,1988,1986,1985,1984,1983,1982,1981,1980,1979,1978,1977,1976,1975,1974,1973,1972,1970,1969,1968,1967,1966,1965,1964
This statistics in other country:
AlbaniaAlgeriaAndorraAngolaAntigua and BarbudaArab WorldArgentinaArmeniaArubaAustraliaAustriaAzerbaijanBahamas, TheBahrainBangladeshBarbadosBelarusBelgiumBelizeBhutanBoliviaBosnia and HerzegovinaBotswanaBrazilBrunei DarussalamBulgariaBurkina FasoBurundiCabo VerdeCambodiaCanadaCaribbean small statesCentral Europe and the BalticsChileChinaColombiaComorosCongo, Dem. Rep.Costa RicaCroatiaCubaCuracaoCyprusCzech RepublicDenmarkDjiboutiDominicaDominican RepublicEarly-demographic dividendEast Asia & PacificEast Asia & Pacific (excluding high income)East Asia & Pacific (IDA & IBRD countries)EcuadorEgypt, Arab Rep.El SalvadorEquatorial GuineaEstoniaEthiopiaEuro areaEurope & Central AsiaEurope & Central Asia (excluding high income)Europe & Central Asia (IDA & IBRD countries)European UnionFijiFinlandFranceGambia, TheGeorgiaGermanyGhanaGreeceGrenadaGuatemalaGuineaGuinea-BissauGuyanaHaitiHigh incomeHondurasHong Kong SAR, ChinaHungaryIBRD onlyIcelandIDA & IBRD totalIDA blendIDA onlyIDA totalIndiaIndonesiaIran, Islamic Rep.IraqIrelandIsraelItalyJamaicaJapanJordanKazakhstanKenyaKiribatiKorea, Dem. People’s Rep.Korea, Rep.KuwaitKyrgyz RepublicLao PDRLate-demographic dividendLatin America & Caribbean Latin America & Caribbean (excluding high income)Latin America & the Caribbean (IDA & IBRD countries)LatviaLeast developed countries: UN classificationLebanonLesothoLiberiaLibyaLiechtensteinLithuaniaLow & middle incomeLower middle incomeLuxembourgMacao SAR, ChinaMacedonia, FYRMadagascarMalawiMalaysiaMaldivesMaliMaltaMauritiusMexicoMiddle East & North AfricaMiddle East & North Africa (excluding high income)Middle East & North Africa (IDA & IBRD countries)Middle incomeMoldovaMonacoMongoliaMontenegroMoroccoMozambiqueMyanmarNamibiaNepalNetherlandsNew ZealandNicaraguaNigeriaNorth AmericaNorwayOECD membersOmanOther small statesPacific island small statesPakistanPanamaPapua New GuineaParaguayPeruPhilippinesPolandPortugalPost-demographic dividendQatarRomaniaRussian FederationRwandaSamoaSan MarinoSao Tome and PrincipeSaudi ArabiaSerbiaSeychellesSierra LeoneSingaporeSint Maarten (Dutch part)Slovak RepublicSloveniaSmall statesSolomon IslandsSomaliaSouth AfricaSouth AsiaSouth Asia (IDA & IBRD)SpainSri LankaSt. LuciaSt. Vincent and the GrenadinesSudanSurinameSwazilandSwedenSwitzerlandSyrian Arab RepublicTajikistanTanzaniaThailandTongaTrinidad and TobagoTunisiaTurkeyTurkmenistanTuvaluUgandaUkraineUnited Arab EmiratesUnited KingdomUnited StatesUpper middle incomeUruguayUzbekistanVenezuela, RBVietnamWorldYemen, Rep.ZambiaZimbabwe Timeline:
This timeline shows a graph from 1964 to 2015 of Uganda. No data until 1963. Number of actual observations by date: 31.
Source name:
World Development Indicators
Source organization:
World Intellectual Property Organization (WIPO), World Intellectual Property Indicators and www.wipo.int/econ_stat. The International Bureau of WIPO assumes no responsibility with respect to the transformation of these data.
Categories, topics:
Science & Technology
Last updated:
apr 23, 2017
Indicators value changes by year
Maximum:
2.666K
jan 1, 2015
At the date of observation
Value
Absolute change
Change from previous value
jan 1, 1964
447.0
+447.0
0.0%
jan 1, 1965
516.0
+69.0
15.44%
jan 1, 1966
643.0
+127.0
24.61%
jan 1, 1967
711.0
+68.0
10.58%
jan 1, 1968
551.0
-160.0
-22.5%
jan 1, 1969
595.0
+44.0
7.99%
jan 1, 1970
560.0
-35.0
-5.88%
jan 1, 1972
575.0
+15.0
2.68%
jan 1, 1973
394.0
-181.0
-31.48%
jan 1, 1974
292.0
-102.0
-25.89%
jan 1, 1975
360.0
+68.0
23.29%
jan 1, 1976
346.0
-14.0
-3.89%
jan 1, 1977
224.0
-122.0
-35.26%
jan 1, 1978
143.0
-81.0
-36.16%
jan 1, 1979
290.0
+147.0
102.8%
jan 1, 1980
196.0
-94.0
-32.41%
jan 1, 1981
258.0
+62.0
31.63%
jan 1, 1982
215.0
-43.0
-16.67%
jan 1, 1983
211.0
-4.0
-1.86%
jan 1, 1984
97.0
-114.0
-54.03%
jan 1, 1985
156.0
+59.0
60.82%
jan 1, 1986
153.0
-3.0
-1.92%
jan 1, 1988
139.0
-14.0
-9.15%
jan 1, 1989
158.0
+19.0
13.67%
jan 1, 1990
98.0
-60.0
-37.97%
jan 1, 1991
158.0
+60.0
61.22%
jan 1, 1992
159.0
+1.0
0.63%
jan 1, 1993
249.0
+90.0
56.6%
jan 1, 2002
14.0
-235.0
-94.38%
jan 1, 2014
2.079K
+2.065K
14.75K%
jan 1, 2015
2.666K
+587.0
28.23%
Ranking of countries by current statistics by years


Comments: